Download
1 / 20
200 likes | 350 Views
World Tuberculosis Day 2014. The TB situation in 2012 : Findings from the joint TB surveillance and monitoring report by ECDC and the WHO Regional Office for Europe . ECDC TB Team European Centre for Disease Prevention and Control Stockholm, 24 March 2014. TB notifications by country.

E N D
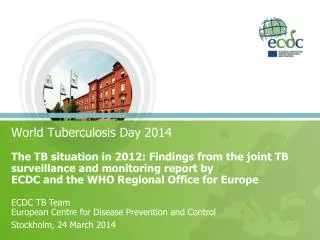
World Tuberculosis Day 2014 The TB situation in 2012: Findings from the joint TB surveillance and monitoring report by ECDC and the WHO Regional Office for Europe ECDC TB TeamEuropean Centre for Disease Prevention and Control Stockholm, 24 March 2014
TB notifications by country • In 2012, 68 423 TB cases were reported in the EU/EEA. • The notification rate was 13.5 per 100 000 population • (range 3.4–85.2). Figure 1: TB notification rate per 100 000 population by country, EU/EEA, 2012 < 10 per 100 000 10 to 19 per 100 000 20 to 49 per 100 000 50 to 99 per 100 000 Not included or not reporting
EU definition: Confirmed TB cases* Overall, 61.9% (range 21.5–91.4%) of TB cases reported in the EU/EEA were laboratory confirmed. • Figure 2: Percentage of laboratory-confirmed TB cases by country, EU/EEA, 2012 < 60% 60 to 69% 70 to 79% ≥ 80% Not included or not reporting * Confirmed by culture or by both a positive sputum microscopy result and Mycobacterium tuberculosis nucleic acid identified in nucleic acid amplification test.
TB in children • In 2012, 2 845 TB cases in children were reported, accounting for 4.2% of all notified TB cases (range 0–7.8%) in the EU/EEA. • Figure 3: TB notification rate in children under 15 years of age per 100 000 child population, by country, EU/EEA, 2012 < 2 per 100 000 child population 2 to 3.9 per 100 000 child population 4 to 9.9 per 100 000 child population ≥ 10 per 100 000 child population Not included or not reporting
TB cases of foreign origin • Figure 4: Percentage of TB cases of foreign origin by country, EU/EEA, 2012 < 1% 1 to 24.9% 25 to 49.9% 50 to 74.9% ≥ 75% Not included or not reporting In 2012, the overall proportion of TB cases of foreign origin in the EU/EEA was 26.8% (range 0.2–85.4%).
Extrapulmonary TB cases • Figure 5: Percentage of extrapulmonary TB cases by country, EU/EEA, 2012 < 10% 10 to 19.9% 20 to 29.9% 30 to 39.9% ≥ 40% Not included or not reporting In 2012, the overall proportion of extrapulmonary TB cases in the EU/EEA was 23.0% (range 2.9–48.6%).
Extrapulmonary TB notification over time • Extrapulmonary TB notification rates have remainedstable in the last 10 years. Figure 6: Extrapulmonary TB notification rate per 100 000 population by year, EU/EEA, 2003−2012
Multidrug-resistant TB • Figure 7: Percentage of multidrug resistance among all confirmed TB cases by country, EU/EEA, 2012 < 1% 1 to 1.9% 2 to 4.9% 5 to 9.9% ≥ 10% Not included or not reporting In 2012, the overall proportion of TB cases with multi-drug resistance in the EU/EEA was 4.6% (range 0–25.5%).
Multidrug-resistance among new pulmonary TB cases • Figure 8: Percentage of new pulmonary TB cases with multidrug resistance by country, EU/EEA, 2012 < 1% 1 to 1.9% 2 to 4.9% ≥ 5% Not included or not reporting In 2012, the overall percentage of new pulmonary TB cases with multidrug resistance in the EU/EEA was 2.6% (range 0–20.5%).
Multidrug-resistance among previously treated pulmonary TB cases • Figure 9: Percentage of previously treated pulmonary TB cases with multidrug resistance by country, EU/EEA, 2012 < 1% 1 to 9.9% 10 to 19.9% ≥ 20% Not included or not reporting In 2012, the overall proportion of previously treated pulmonary TB cases with multidrug resistance in the EU/EEA was 18.8% (range 0–50.0%).
Extensively drug-resistant TB • Figure 10: Percentage of extensively drug-resistant TB cases among multidrug-resistant TB cases tested for second-line drug susceptibility, by country, EU/EEA, 2012 < 1% 1 to 9.9% 10 to 19.9% ≥20% Not included or not reporting In 2012, the proportion of extensively drug-resistant TB cases among multidrug-resistant cases in EU/EEA was 13.7% (range 0–50.0%).
TB/HIVco-infection • Figure 11: Percentage of HIV-positive cases among TB cases with known HIV status, by country, EU/EEA, 2012 < 1% 2 to 4.9% 5 to 9.9% • ≥ 10% Not included or not reporting In 2012, the overall proportion HIV positive among TB cases with known HIV status in EU/EEA was 5.5% (range 0–16.5%).
Treatment success in new pulmonary TB cases over time • The treatment success rate in new culture-confirmed pulmonary TB cases notified between 2007 and 2011 has slightly decreased from 79.2% in 2007 to 76.5% in 2011. Figure 12: 12-month treatment success rate in new culture-confirmed pulmonary TB cases by year of initial case reporting, EU/EEA, 2007–2011
Treatment success in new pulmonary TB cases • Treatment success rate for culture-confirmed new pulmonary TB cases notified in 2011 was 76.5% (range: 0–91.3%). Figure 13: Treatment success rate in culture-confirmed new pulmonary TB cases notified in 2011, by country, EU/EEA, 2012 * Iceland and Malta reported zero new TB cases in 2011. Three EU/EEA Member States did not report treatment outcome data
Treatment success in previously treated pulmonary TB cases • The treatment success rate for previously treated culture-confirmed pulmonary TB cases notified in 2011 was 55.2% (range 25.0–100.0%). Figure 14: Treatment success rate in previously treated culture-confirmed pulmonary TB cases notified in 2011, by country, EU/EEA * Iceland and Malta reported zero previously treated TB cases in 2011. Three EU/EEA Member States did not report treatment outcome data stratified by treatment history
Treatment success rate in confirmed pulmonary TB cases* • The treatment success rate for all confirmed pulmonary TB cases notified in 2011 was 72.4% (range 0–90.4%). Figure 15: Treatment success rate in laboratory confirmed pulmonary TB cases notified in 2011, by country, EU/EEA, 2012 * Four EU/EEA Member States did not report treatment outcome data
Treatment success rate in extrapulmonary TB* • The treatment success rate in extrapulmonary TB cases notified in 2011 was 82.2% (range 59.0–100%). Figure 16: Treatment success rate in extrapulmonary TB cases notified in 2011, by country, EU/EEA, 2012 * Five Member States did not report stratified treatment outcome data
Treatment success rate in multidrug-resistant TB* • The treatment success rate for all multidrug-resistant TB cases notified in 2010 was 33.6% (range 0–100.0%). Figure 17: 24-month treatment success rate in multidrug-resistant TB cases notified in 2010, by country, EU/EEA, 2012 * Slovenia reported zero MDR TB cases in 2010, 9 Member States did not report treatment outcome data for MDR TB cases
Treatment outcome in multidrug-resistant TB over time • Treatment outcomes for multidrug-resistant TB cases improved slightly between the 2008 and 2010 cohort, EU/EEA. Figure 18: 24-month treatment outcome in multidrug-resistant TB cases notified from 2008 to 2010, by year of initial case reporting, EU/EEA, 2012
Treatment success in extensively drug-resistant TB* • The treatment success rate in extensively drug-resistant TB cases notified in 2009 was 25.0% (range 0–66.7%). Figure 19: 36-month treatment success rate in extensively drug-resistant TB cases notified in 2009, by country, EU/EEA, 2012 Treatment success (%) * Cyprus, Denmark, Iceland, Malta, Slovakia, Slovenia and Sweden reported zero XDR TB cases in 2009, 12 countries did not report SLD DST results or stratified treatment outcome data 20