Download
1 / 8
80 likes | 247 Views
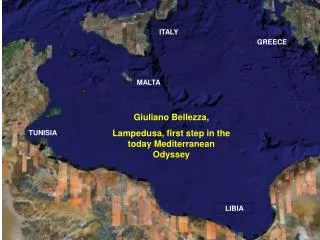
Demographic Comparison Tunisia and Zimbabwe. All data from 2005 Population Data sheet unless otherwise stated www.prb.org. Task: Apply Level 4 analysis to data - ID Level 2 Patterns Attempt to answer Level 3 whys? . Natural Increase / Fertility Rate. Birth rate and Death Rate.

E N D
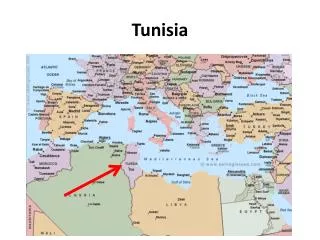
Demographic Comparison Tunisia and Zimbabwe All data from 2005 Population Data sheet unless otherwise stated www.prb.org Task: Apply Level 4 analysis to data - ID Level 2 Patterns Attempt to answer Level 3 whys?
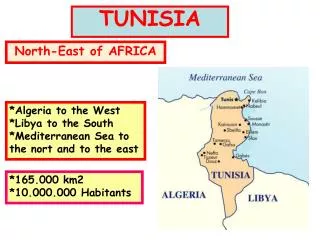
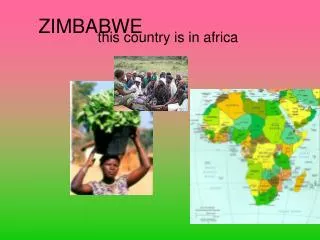
2005 Same Natural Increase Different Pyramid - Why?Zimbabwe / Tunisia
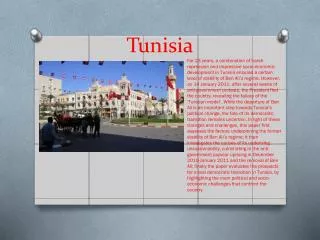
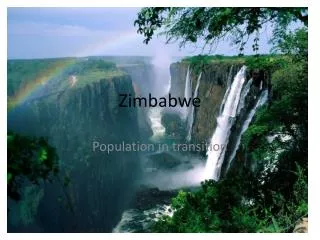
Things to think about • Tunisia seems to fit demographic transition model based on BR, DR, urban %, income etc. • Zimbabwe data doesn’t fit typical mold for current LDC. What isn’t typical and why?
Adult rates of AIDS in Africa Source: http://www.prcdc.org/summaries/aidsinafrica/aidsinafrica.html
Possible Free Response Question • Using the data, maps and population pyramids identify and explain two demographic (population) problems that Zimbabwe is currently facing. Support your explanation with specific examples and details (6 pts)