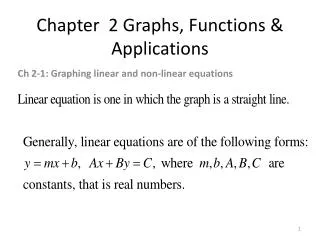
Chapter 2: Functions and Graphs
Learn about functions, domain, range, relations, and graphs. Explore examples, notations, and how to determine if a relation is a function. Discover how to find domain and range from graphs.

Chapter 2: Functions and Graphs
E N D
Presentation Transcript
FlasBack… What the correlation ?
There are other ways to describe relations between variables. • Set to set • Ordered pairs
A set of ordered pairs (x, y) is also called a relation. • The domain is the set of x-coordinates of the ordered pairs. • The range is the set of y-coordinates of the ordered pairs.
Example 1 Find the domain and range of the relation {(4,9), (-4,9), (2,3), (10,-5)} • Domain is the set of all x-values, {4, -4, 2, 10}. • Range is the set of all y-values, {9, 3, -5}.
Example 2 Domain: {Polar Bear, Cow, Chimpanzee, Giraffe, Gorilla, Kangaroo, Red Fox} Range: {20, 15, 10, 7}
Some relations are also functions. A function is a set of order pairs in which each first component in the ordered pairs corresponds to exactlyone second component.
x y RANGE DOMAIN f FUNCTION CONCEPT
y1 y2 RANGE R x DOMAIN NOT A FUNCTION
x1 y x2 RANGE DOMAIN f FUNCTION CONCEPT
X Y 1 2 5 10 -1 -2 3 6 Ways to Represent a Function • Graphical • Symbolic • Numeric • VerbalThe cost is twice the original amount.
FUNCTION NOTATION Name of the function • Output Value• Member of the Range• Dependent Variable These are all equivalent names for the y. • Input Value• Member of the Domain• Independent Variable These are all equivalent names for the x.
Example 3 y = -3x + 2 so represents a function. • We often use letters such as f, g, and h to name functions. • We can use the function notationf(x) (read “f of x”) and write the equation as f(x) = -3x + 2. Note: The symbol f(x) is a specialized notation that does NOT mean f• x (f times x).
to evaluate a function at x substitute the x-value into the notation. • Example 4 f(x) = -3x + 2, f(2) = -3(2) + 2 = -6 + 2 = -4.
Example 5 • g(x) = x2 – 2x • find g(-3) • write down the corresponding ordered pair. • Answer : • g(-3) = (-3)2 – 2(-3) = 9 – (-6) = 15. • The ordered pair is (-3, 15).
Drawing Graphs of Functions • A way to visualize a function is by drawing its graph • The graph of a real function f of one variable is the set of all points P(x, y) in the plane such that y = f(x). • Plot the value of x on the horizontal, or x-axis and the value of f(x) on the vertical, or y-axis. • How can we tell whether a set of points in the plane is the graph of some function? By reading the definition of a function again, we have an answer.
Domain and Range Ex 6. Given the relation {(4,9), (-4,9), (2,3), (10,-5)}, is it a function? Since each element of the domain(x-values) is paired with only one element of the range (y-values), it is a function. Note: Each x-value has to be assigned to ONLY one y-value!!!
Example 7 • Is the relation y = x2 – 2x a function? • Since each element of the domain (the x-values) would produce only one element of the range (the y-values), it is a function. • Question: • What does the graph of this function look like? • Does this graph pass • the vertical line test?
Example 8 • Is the relation x2 + y2 = 9 a function? • Since each element of the domain (the x-values) would correspond with 2 different values of the range (both a positive and negative y-value), the relation is NOT a function • Check the ordered pairs: (0, 3) (0, -3) • The x-value 0 corresponds to two different y-values, so the relation is NOT a function. • Question: What does the graph of this relation look like?
Range Domain Ex
Example 9 y x Use the vertical line test to determine whether the graph to the right is the graph of a function. Since no vertical line will intersect this graph more than once, it is the graph of a function.
Example 10 y x Use the vertical line test to determine whether the graph to the right is the graph of a function. Since no vertical line will intersect this graph more than once, it is the graph of a function.
Example 11 y x Use the vertical line test to determine whether the graph to the right is the graph of a function. Since a vertical line can be drawn that intersects the graph at every point, it is NOT the graph of a function.
Example 12 y x Use the vertical line test to determine whether the graph to the right is the graph of a function. Since vertical lines can be drawn that intersect the graph in two points, it is NOT the graph of a function.
y Domain x Range Domain is [-3, 4] Range is [-4, 2] Determining the domain and range from the graph of a relation: Example: Find the domain and range of the function graphed (in red) to the right. Use interval notation.
Example 13 y Range x Domain is (-, ) Range is [-2, ) Domain Find the domain and range of the function graphed to the right. Use interval notation.
Example 14 y x Find the domain and range of the function graphed to the right. Use interval notation. Domain: (-, ) Range: (-, )
Example 15 y x Find the domain and range of the function graphed to the right. Use interval notation. Domain: (-, ) Range: [-2.5] (The range in this case consists of one single y-value.)
Example 16 y x Find the domain and range of the relation graphed to the right. Use interval notation. (Note this relation is NOT a function, but it still has a domain and range.) Domain: [-4, 4] Range: [-4.3, 0]
Example 17 y x Find the domain and range of the relation graphed to the right. Use interval notation. (Note this relation is NOT a function, but it still has a domain and range.) Domain: [2] Range: (-, )
Decide the Domain and Range: Graph Homework 1