Download
1 / 1
10 likes | 108 Views
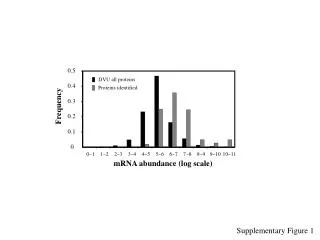
This study examines the frequency of protein identification and mRNA abundance across all proteins, represented in log-scale values. The Supplementary Figure 1 provides a visual representation of the data.

E N D
0.5 DVU all proteins 0.4 Proteins identified 0.3 Frequency 0.2 0.1 0 0~1 1~2 2~3 3~4 4~5 5~6 6~7 7~8 8~9 9~10 10~11 mRNA abundance (log scale) Supplementary Figure 1


