Download
1 / 41
420 likes | 555 Views
This seminar examines U.S. agri-environmental policies, focusing on key conservation programs such as the Conservation Reserve and Environmental Quality Incentives Programs. The discussion covers program design options, their implications for environmental outcomes, and future directions, including green payments and responses to ethanol market dynamics. The objectives of these policies range from maintaining soil and water quality to promoting wildlife habitat and carbon sequestration, ultimately aiming for sustainable agriculture and environmental stewardship.

E N D
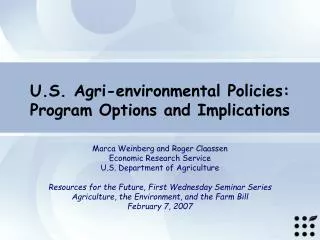
U.S. Agri-environmental Policies: Program Options and Implications Marca Weinberg and Roger Claassen Economic Research Service U.S. Department of Agriculture Resources for the Future, First Wednesday Seminar Series Agriculture, the Environment, and the Farm Bill February 7, 2007
Outline • U.S. Conservation Programs • Primer • Design Options and Implications • Options for the future • Green Payments • Implications of Ethanol Market Dynamics
U.S agri-environmental policy has wide-ranging objectives • Maintaining soil quality • Improving water quality • Increasing wildlife habitat • Improving air quality • Increasing carbon sequestration • Conserving energy and water • Preserving farm and ranch lands
USDA/NRCS Conservation Programs Community Assistance Programs and Activities Farmland Protection Policy Act Resource Conservation and Development Program Small, Limited, and Beginning Farmer Assistance Tribal Government Assistance Community Assistance Technical Processes, Tools, and Resources Area-wide and Watershed Planning Comprehensive Nutrient Management Planning Conservation Planning Customer Service Toolkit Land Evaluation and Site Assessment Limited Resource Farmer Self-Determination Tool Rapid Watershed Assessment Conservation Issues and Strategies Animal Feeding Operations National Animal Agriculture Conservation Framework Compliance, Appeals, Mediation, Relief Conservation Compliance - HEL and Wetland Conservation Other Forestry Incentives Program Stewardship Incentive Program(USDA Forest Service) Conservation Technical Assistance Program and Activities Conservation of Private Grazing Lands Cooperative Conservation Partnership Initiative Conservation Planning Sign-Up Pilot Conservation Reserve Program(USDA Farm Service Agency) Conservation Technical Assistance Grazing Lands Conservation Initiative Locally Led Conservation State Technical Committees Environmental Improvement Programs Agricultural Management Assistance Environmental Quality Incentives Program - Colorado River Basin Salinity Control - Conservation Innovation Grants - Ground and Surface Water Conservation Program - Klamath Basin Program Wildlife Habitat Incentives Program Stewardship Programs Conservation Security Program Water Resources Programs Emergency Watershed Protection Program (Recovery) Watershed Protection and Flood Prevention Program Easement Programs Emergency Watershed Protection Program Farm and Ranch Lands Protection Program Grassland Reserve Program Healthy Forests Reserve Program Wetlands Reserve Program
U.S. Conservation policy relies on a portfolio of programs and approaches • Voluntary payment programs • Land retirement • Working lands • Land preservation • Compliance Mechanisms • Environmental Regulations
Agri-environmental “portfolio”: land retirement Conservation Reserve Program (CRP) • Retire highly erodible or otherwise environmentally sensitive cropland for 10 or more years; • 35 million acres – about 10 percent of cropland -- enrolled Wetland Reserve Program (WRP) • Restore wetlands on marginal cropland, easements can be long-term or even permanent • ~ 1.7 million acres currently enrolled
Agri-environmental “portfolio”: working land Environmental Quality Incentives Program (EQIP) • Provides cost-sharing or incentive payments • Addresses wide range of environmental problems • 60 % of funds targeted to livestock-related issues • $1 billion in 2006 Conservation Security Program (CSP) • Targets “good stewards” through stewardship payments • Encourages additional conservation through “enhancements” • $260 million in 2006
Compliance mechanisms Basic environmental compliance required to receive farm program payments: • Sodbuster/Conservation Compliance: Apply conservation systems on highly erodible cropland • Swampbuster: Refrain from draining wetland
Trends in USDA Conservation Expenditures, 1983-2005 Note: Expenditures include producer financial and technical assistance only Source: ERS analysis of data from USDA Office of Budget and Policy Assessment
A multitude of program design decisions affect program outcomes All Farmers Program Participants • Program Performance • Economic • Environmental • Distributional
A multitude of program design decisions affect program outcomes All Eligible Farmers All Farmers Program Participants • Eligibility • usually broad • ·Land types • Land use • Location • ·Practices • Program Performance • Economic • Environmental • Distributional
A multitude of program design decisions affect program outcomes All Eligible Farmers All Farmers Program Applicants Program Participants • Program Performance • Economic • Environmental • Distributional • Eligibility • usually broad • ·Land types • Land use • Location • ·Practices Participation Incentive What action? · Fields · Practices What payment? · Fixed · Bid
A multitude of program design decisions affect program outcomes Program Budget All Eligible Farmers All Farmers Program Applicants Program Participants • Program Performance • Economic • Environmental • Distributional • Eligibility • usually broad • ·Land types • Land use • Location • ·Practices Participation Incentive What action? · Fields · Practices What payment? · Fixed · Bid • Enrollment Screen • (targeting) • Benefit-cost index • · Field Location • Soils • Topography • Population • · Practices • Cost (bid)
Cost-effective payment program design:Who, how much, for what? • Identify and enroll (target) producers, land, and practices that can deliver environmental benefits at lowest cost • Payments must leverage additional conservation effort • Pay minimum amount producer is willing to accept for adopting specified conservation practices
Participant Bidding Enhances Cost Effectiveness Program Cost ($million) Fixed payment rates Bid-based payments Environmental Performance Index (% change) Source: Johansson, Participant Bidding Enhances Cost Effectiveness, ERS, USDA, EB3, March 2006
Paying for performance is more cost- effective than paying for practices Program Cost ($million) Practice-based Performance-based Environmental Performance (million env. index points) Source: Weinberg and Claassen, Rewarding Practices vs Environmental Performance, ERS, USDA, EB5, March 2006
“Green Payments:” Achieving Environmental and Income Objectives?
Distribution of payments, 2004 • Conservation AND Commodity Payments • 43% of conservation payments • 6% of all farms • 15% of farms receiving Federal payments Commodity Payments $8 billion 25% of all farms 63% of farms with federal payments Conservation Payments $2 billion 14% of all farms 34% of farms receiving Federal payments Source: ERS analysis of 2004 ARMS data
Commodity and conservation payments go to different farm types… Source: Claassen and Morehart, Greening Income Support and Supporting Green, ERS, USDA, EB1, March 2006
…and different regions Source: Claassen and Morehart, Greening Income Support and Supporting Green, ERS, USDA, EB1, March 2006
Summary: Green Payments • Conservation and commodity payments don’t generally go to the same producers • Distribution of environmental payments, based on potential environmental gain, would be quite different from existing commodity payments • Expanded compliance requirements could leverage more gain, but could also change distribution of effective income support
Environmental Implications of Ethanol Market Dynamics
Ethanol’s role in gasoline and corn markets is asymmetric Ethanol is small relative to overall gasoline use…. But it accounts for a large and growing share of corn use Ethanol Ethanol 3% 12% Food, seed & industrial 11% Feed and residual 45% Ending stocks 16% Gasoline Exports 97% 16%
Ethanol expansion is greater than levels set in the Renewable Fuel Standard Corn used for ethanol production (billion bushels) Implied by RFS Current 2006 projection Crop year
Where will the corn come from? • Stocks are the first choice for additional corn • Corn use may shift • Stocks are the first choice for additional corn
Where will the corn come from? • Stocks are the first choice for additional corn • Corn use may shift • Stocks are the first choice for additional corn
Corn use may shift • Feed and residual use of corn is expected to weaken as feeders shift rations • Increased ethanol production from corn has increased the supply of distillers dried grains (DDGs) • In livestock rations, distillers dried grains can substitute for corn and soybean meal or urea; Substitutions vary by livestock type • Nutrient content of rations could increase with DDGs
Where will the corn come from? • Stocks are the first choice for additional corn • Corn use may shift • Corn supply may increase
Corn supply may increase • Corn yields have increased over time and should continue to increase • Depending on relative prices, more land may be devoted to corn • Shift in rotation with soybeans • Less pasture and hay • Less CRP? • It may be feasible to get more ethanol per acre by using more of the corn plant
Land use change Nutrient management Fertilizer use Animal waste Advances in cellulosic ethanol production? Implications for: Water quality Air quality Wildlife habitat Environmental Issues and Uncertainties ? ? • Soil erosion • Land use • Wildlife habitat
Summary and Concluding Comments • Portfolio of programs • Multiple programs and multiple objectives • Answes to “who gets, how much, for doing what?” will determine program performance • Performance-based payments most cost effective … but hardest to implement • Green payments: • would involve changing distribution of payments and/or • reduced environmental effectiveness • Environmental implications of ethanol market dynamics are not well understood, but research is underway
For more information: • Amber Waves (July 2006) – Agriculture and the Environment www.ers.usda.gov/AmberWaves/july06specialissue • Economic Briefs on Conservation Program Design: • Greening Income Support and Supporting Green • www.ers.usda.gov/publications/eb1 • Better Targeting, Better Outcomes • www.ers.usda.gov/publications/eb2 • Participant Bidding Enhances Cost Effectiveness • www.ers.usda.gov/publications/eb3 • Contrasting Working-land and Land Retirement Programs www.ers.usda.gov/publications/eb4 • Rewarding Farm Practices versus Environmental Performance • www.ers.usda.gov/publications/eb5 • Cattaneo, A., R. Claassen, R. Johansson, and M. Weinberg, Flexible Conservation Measures on Working Land, Economic Research Report No. 5 (ERR5), Economic Research Service, USDA, (June 2005),79 pp. www.ers.usda.gov/err5
… and paying for improvements in performance is most cost-effective Good performance without sodbuster Good performance (with sodbuster) Improved Performance (with sodbuster) Source: Weinberg and Claassen, Rewarding Practices vs Environmental Performance, ERS, USDA, EB5, March 2006
Conservation Payments and the WTO: “Green Box” Support • Official Language: “Payments under environmental programs must meet the following policy “specific criteria” and conditions: a) Eligibility for such payments shall be determined as part of a clearly-defined government environmental or conservation programme and be dependent on the fulfillment of specific conditions under the government programme, including conditions related to production methods or inputs; and b) The amount of payment shall be limited to the extra costs or loss of income involved in complying with the government programs.” (URAA/WTO) • Conventional Wisdom: • “Minimally trade distorting” • Payments do not exceed costs • Open Questions: • Payments for performance/ecosystem services? • Role for cost-effectiveness?
What can farmers sell? • Water quality • Biodiversity • Carbon sequestration • Open space • Recreation • Organic produce
Making a market work • Clear demand for a good, expressed in terms of willingness to pay • Ability to supply a good of a known and easy-to-measure quantity/quality at a reasonable cost • Clear and enforceable rules for buying and selling (e.g., property rights)
Why do markets (for ecosystem services) fail? • Information asymmetries • Transaction Costs • Lack of effective demand • Free-riding • Quality uncertainty • Lack of effective supply • Fear (liability, future regulation) • Institutional barriers • Information costs
Potential Government Roles • Education (for buyers and sellers) • Certification, verification, auditing create property rights • Labeling (e.g., organic) • Measurement (e.g., carbon inventory) • Reduce transaction costs • Act as clearinghouse • Act as purchasing agent • Regulatory pressures (create or relieve)