Download
1 / 16
160 likes | 177 Views
Engage students in real-life project using Excel for analysis, survey, Descriptive statistics, Probability. Includes team roles, brainstorming, statistical functions, and hypothesis testing. Student feedback on relatable example. Contact Georgette Nicolaides at georgette.g.nicolaides@gmail.com

E N D
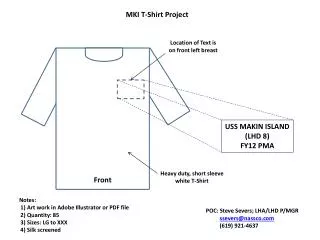
Engaging Business Students with a T-Shirt Marketing ProjectUsing Excel Georgette Nicolaides eCOTS 2016
Overview • Outcomes • Immediately apply knowledge to real-life project • Mitigate anxiety with familiar topic • Utilize Excel for analysis • Simple market research project connected to future classes
Team roles • Coordinator • Recorder • Troubleshooter • Reporter
Brainstorming • Individual • Group • Select variables
Variables • At least two quantitative • At least two categorical • A total of at least six variables
Survey and results • Google Forms • At least 50 responses • Clean data
Probability and inference • Probability • Example: What is the probability that over 50% of female students will buy a small t-shirt? • Confidence intervals • Example: Create a 95% confidence interval for the percentage of male students who will purchase a large or extra large t-shirt. • Hypothesis tests – one and two populations • Historically, SU students are willing to spend $15 on a t-shirt. Has this changed? Test at alpha = 0.05. • Consider the proportion of males who wear large or extra large t-shirts. Then, consider the proportion of females who wear large or extra large t-shirts. Create a 95% confidence interval for the difference.
Statistical report outline • Title • Abstract • Introduction • Methods • Results, Conclusions and Recommendations • Appendix
Student feedback • “The most help was when doing the hypothesis testing for the project it helped me understand the information for the test” • “The t-shirt was helpful because it’s a relatable example.” • “…easy to grasp” • “Was good to relate concepts to personal data” • “It forced us to apply the formulas we learned in class to analyze the data”
Contact information Georgette Nicolaides georgette.g.nicolaides@gmail.com www.linkedin.com/in/georgettenicolaides If you would like copies of the handouts, please visit http://georgettenicolaides.wordpress.com/ecots-2016 If you use this, I would like to hear about any improvements you make Thanks!