Download
1 / 10
100 likes | 221 Views
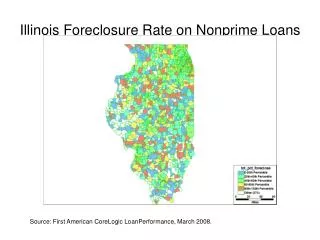
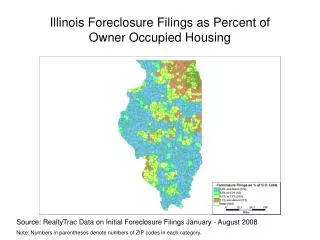
Illinois Foreclosure Filings as Percent of Owner Occupied Housing. Source: RealtyTrac Data on Initial Foreclosure Filings January - August 2008 Note: Numbers in parentheses denote numbers of ZIP codes in each category. .

E N D
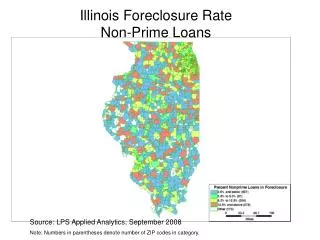
Illinois Foreclosure Filings as Percent of Owner Occupied Housing Source: RealtyTrac Data on Initial Foreclosure Filings January - August 2008 Note: Numbers in parentheses denote numbers of ZIP codes in each category.
Chicago Area Foreclosure Filings as Percent of Owner Occupied Housing, Top 25th Percentile Source: RealtyTrac Data on Initial Foreclosure Filings January - August 2008 Note: Numbers in parentheses denote numbers of ZIP codes in each category.
Michigan Foreclosure Filings as Percent of Owner Occupied Housing Source: RealtyTrac Data on Initial Foreclosure Filings January - August 2008 Note: Numbers in parentheses denote numbers of ZIP codes in each category.
Michigan Foreclosure Filings as Percent of Owner Occupied Housing, Top 25th Percentile Source: RealtyTrac Data on Initial Foreclosure Filings January - August 2008 Note: Numbers in parentheses denote numbers of ZIP codes in each category.
Indiana Foreclosure Filings as Percent of Owner Occupied Housing Source: RealtyTrac Data on Initial Foreclosure Filings January - August 2008 Note: Numbers in parentheses denote numbers of ZIP codes in each category.
Indianapolis Area Foreclosure Filings as Percent of Owner Occupied Housing, Top 25th Percentile Source: RealtyTrac Data on Initial Foreclosure Filings January - August 2008 Note: Numbers in parentheses denote numbers of ZIP codes in each category.
Wisconsin Foreclosure Filings as Percent of Owner Occupied Housing Source: RealtyTrac Data on Initial Foreclosure Filings January - August 2008 Note: Numbers in parentheses denote numbers of ZIP codes in each category.
Wisconsin Foreclosure Filings as Percent of Owner Occupied Housing, Top 25th Percentile Source: RealtyTrac Data on Initial Foreclosure Filings January - August 2008 Note: Numbers in parentheses denote numbers of ZIP codes in each category.
Iowa Foreclosure Filings as Percent of Owner Occupied Housing Source: RealtyTrac Data on Initial Foreclosure Filings January - August 2008 Note: Numbers in parentheses denote numbers of ZIP codes in each category.
Iowa Foreclosure Filings as Percent of Owner Occupied Housing, Top 25th Percentile Source: RealtyTrac Data on Initial Foreclosure Filings January - August 2008 Note: Numbers in parentheses denote numbers of ZIP codes in each category.