Download
1 / 10
100 likes | 230 Views
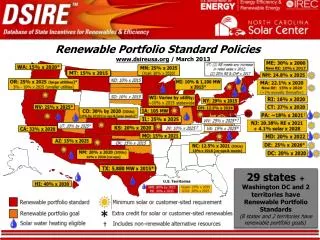
This document presents a detailed overview of California's renewable energy landscape as of February 2011, highlighting PG&E's power mix and the significant increase in renewable deliveries since the Renewable Portfolio Standards (RPS) program was initiated. In 2008, eligible renewables accounted for only 2% of the mix, but PG&E has executed 109 contracts totaling over 8,800 MW of renewable energy from sources like wind, solar, and geothermal. Key challenges such as permitting and financing, alongside a focus on executing existing projects, are essential for achieving future RPS goals.

E N D
Renewables Portfolio Standard: Progress and Perspectives Aaron J. Johnson Director, Renewable Energy Policy & Strategy February 1, 2011
PG&E Power Mix • For comparative purposes, California’s 2008 Power Mix was: • Eligible Renewables – 2% • Coal – 34% • Large Hydroelectric – 18% • Natural Gas – 42% • Nuclear – 5% • Other – 0%
Renewables Deliveries have Increased Significantly Since the RPS Program Was Implemented
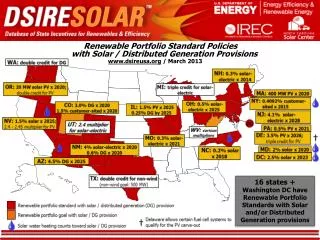
PG&E RPS Contracts In total, well more than 20% currently under contract PG&E has signed 109* RPS contracts totaling over 8,800 MW since 2002 # MWs Geothermal 9 661 Wind 34 2,777 Bioenergy 24 277 Solar PV 22 2,336 Solar Thermal 13 2,735 Small Hydro 6 51 Wave 1 2 Total 109 8,838 * Does not include small renewable generator PPAs ** Map does not include failed contracts
PG&E RPS Projects: Energy Delivery Statistics • - 109 Executed Contracts • - 54 contracts to build new facilities • 9 have achieved commercial operation – 4 in-state and • 5 out-of-state • 34 active contracts with Guaranteed Commercial Operation Date in 2011 – 2013 • 11 active contracts with Guaranteed Commercial Operation in post-2013 period • 42 contracts with existing and • repowered facilities • 13 contracts failed, not approved, or • expired
PG&E’s Contracted Mix of Renewables Will Shift Significantly Over This Decade Reflects RPS contracts executed as of December 2010, including contracts pending CPUC approval. Assumes all contracts perform as expected per the contract. 2010 Mix 2020 Mix 2015 Mix
Most of PG&E’s Renewable Deliveries are Expected to Come from In-state Facilities Based on current RPS contracts and assumes all contracts perform as expected per the contract.
The Market Price Referent (MPR) provides a benchmark to assess the cost of renewables
Challenges • Host of well-recognized challenges: permitting, interconnection, transmission, financing, grid reliability, etc. • However, emphasis should be on two key ideas: • Execute on the program and projects in progress • Focus on approving contracts and permitting projects & transmission, not designing new programs • Ensure agency staff have the resources to implement the program • Design a program that can succeed going forward • Planning for 33% RPS is well underway and rules are still unclear • Set realistic and achievable goals that demonstrate CA’s RPS program works • Provide utilities with broad procurement tools to manage customer costs