Download
1 / 19
190 likes | 212 Views
This article examines the external factors that may have influenced the results of the FCAT Reading test in Grade 3 from 2005 to 2007. It analyzes the population of test takers, the testing processes, and instructional changes that may have affected the scores.

E N D
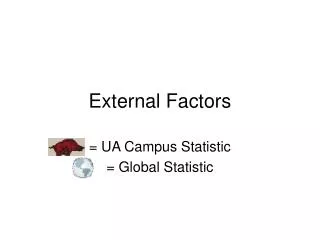
External Factors Review:GRADE 3FCAT READING2005, 2006, 2007 Jay Pfeiffer, Deputy Commissioner June 1, 2007
Basic Issues Impacting Results • The Population of Test Takers • The Testing Processes • Instructional Changes
Grade 3FCAT Reading Test Takers *Enrollment is based on Survey 3 data for all years. **2007 represents preliminary enrollment data.
Grade 3Students Enrolled by Race 120,000 100,000 80,000 60,000 40,000 20,000 0 2005 2006 2007 23.71% 23.49% 23.24% AFRICAN AMERICAN 24.09% 24.76% 25.56% HISPANIC 46.31% 45.36% 44.44% WHITE .29% .30% .30% AMERICAN INDIAN/ALASKAN NATIVE 2.11% 2.25% 2.24% ASIAN 3.49% 3.83% 4.22% MULTIRACIAL *Enrollment is based on Survey 3 data for all years. **2007 represents preliminary enrollment data.
FCAT Reading, Grade 3Percentage of Students Retained in Prior Years *2007 represents preliminary data.
FCAT Reading, Grade 3Percentage of Test Takers by Year Retained *2007 represents preliminary data.
Grade 3Free and Reduced LunchNumber of Students Enrolled and Taking FCAT Reading *Enrollment is based on Survey 3 data for all years. **2007 represents preliminary enrollment data.
Grade 3Enrolled English Language LearnersNumber of Students Enrolled and Taking FCAT Reading *Enrollment is based on Survey 3 data for all years. **2007 represents preliminary enrollment data.
Grade 3Students With DisabilitiesEnrolled and Taking FCAT Reading *Enrollment is based on Survey 3 data for all years. **2007 represents preliminary enrollment data.
Percentage of Students in October Who were Present in February
Number of Teachers and Reading Teachers Serving Grade 3 *Student courses include: Third Grade (Self-Contained, English for Speakers of Other Language: Language Arts, Elementary), Integrated Language Arts – Elementary, Reading – Elementary, Reading: K-5 – ESE, and Academics: K-5 – ESE ** Student courses include only: Reading - Elementary, Reading: K-5 - ESE, and Functional Basic Skill in Reading - Elementary
Teachers and Reading Teachers Serving Grade 3Years of Experience *Student courses include: Third Grade (Self-Contained, English for Speakers of Other Language: Language Arts, Elementary), Integrated Language Arts – Elementary, Reading – Elementary, Reading: K-5 – ESE, and Academics: K-5 – ESE ** Student courses include only: Reading - Elementary, Reading: K-5 - ESE, and Functional Basic Skill in Reading - Elementary
Teachers and Reading TeachersServing Grade 3Percentage of Beginning Teachers *Student courses include: Third Grade (Self-Contained, English for Speakers of Other Language: Language Arts, Elementary), Integrated Language Arts – Elementary, Reading – Elementary, Reading: K-5 – ESE, and Academics: K-5 – ESE ** Student courses include only: Reading - Elementary, Reading: K-5 - ESE, and Functional Basic Skill in Reading - Elementary
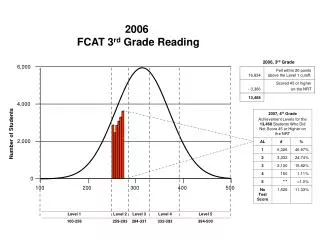
2005 Sunshine State Standards 8,000 6,000 2006 Sunshine State Standards Frequency 4,000 10,000 2,000 8,000 2007 Sunshine State Standards 6,000 0 Frequency 100 200 300 400 500 Level 1 Level 2 Level 3 Level 4 Level 5 8,000 Score 4,000 Mean = 305.47 Std. Dev. = 64.338 6,000 2,000 Frequency 0 4,000 100 200 300 400 500 Level 2 Level 3 Level 4 Level 5 Level 1 Score Mean = 313.64 Std. Dev. = 56.721 2,000 N = 203,210 0 100 200 300 400 500 Level 1 Level 2 Level 3 Level 4 Level 5 Score Mean = 309.41 Std. Dev. = 64.992 N = 200,938 Sunshine State Standards N = 202,765
FCAT Reading, Grade 32004 to 2005 Anchor Items and Common Items
2006 is an average of 3.5% higher FCAT Reading, Grade 32005 to 2006 Anchor Items and Common Items