Download
1 / 44
510 likes | 954 Views
Landsat ETM+ scan line corrector (SLC) – failed May 31 2003 http://landsat.usgs.gov/products_slc_off_data_information.php. SLC compensates for forward motion of the scanner during scan. Website: http://asterweb.jpl.nasa.gov/ Gallery: http://asterweb.jpl.nasa.gov/gallerymap.asp.

E N D
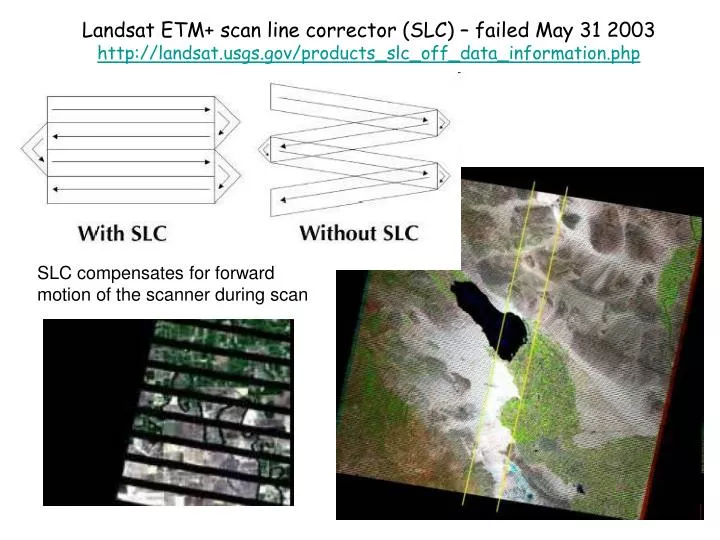
Landsat ETM+ scan line corrector (SLC) – failed May 31 2003http://landsat.usgs.gov/products_slc_off_data_information.php SLC compensates for forward motion of the scanner during scan
Website: http://asterweb.jpl.nasa.gov/ Gallery: http://asterweb.jpl.nasa.gov/gallerymap.asp ASTER: ‘Landsat –like’Nuuk, Greenland
TERRA (EOS AM-1) The EOS flagshipdata since Feb 24, 2000 (launch 18 Dec 1999)705 km, 10.30am descending
MODIS ASTER (TIR) ASTER (SWIR) ASTER (VNIR) MISR MOPITT CERES Terra Satellite Terra is the flagship of NASA's Earth Science Enterprise. ASTER is the ‘zoom lens’ of Terra..
TERRA: THE EARTH OBSERVING SYSTEM (EOS) AM-1http://www.gsfc.nasa.gov/gsfc/service/gallery/fact_sheets/earthsci/terra/terra_eos_am.htmASTERAdvanced Spaceborne Thermal Emission and Reflection Radiometer JAPANMODIS Moderate-resolution Imaging SpectroradiometerCERESClouds and the Earth's Radiant Energy System (thermal)MISRMulti-angle Imaging Spectro-Radiometer VNIR at 26, 46 60, 70 degreesMOPITTMeasurement of Pollution in the Troposphere (CO, CH4)http://www.atmosp.physics.utoronto.ca/MOPITT/home.html CANADA
In mid-April 2000, the Terra spacecraft was turned upside down and pointed at the Moon. This ASTER image was acquired at that time, showing band 3 visible in black and white.
ASTER bands versus Landsat ETM+ 60 km swath, 16 day repeat cyle
Visible-NIR Visible-NIR Short Wave IR Thermal IR
August ’03 Montana Forest Fire ASTER 3-2-1 RGB composite 5 km Normalized Difference Burn Ratio, developed for TM, applied to ASTER bands 4 & 6 Burn Ratio (TM4-TM7)/(TM4+TM7)
ASTER Volcano Archive http://ava.jpl.nasa.gov/ava.asp http://www.volcano.si.edu/gvp/volcano/index.htm
ASTER Response to Indian Ocean Tsunami Banda Aceh before tsunami (left) and 5 days after tsunami (right)
ASTER Response to Indian Ocean Tsunami Phuket, Thailand before tsunami (left), 5 days after tsunami (center), and merged with SRTM data of 10m elevation
ASTER – imagery and DEMs 2000- Global DEM to 83 degrees latitude Sample ASTER draped image
ASTER data comes in three packages for VNIR, SWIR, TIR This fly combines the DEM only with VNIRhttp://visibleearth.nasa.gov/view_rec.php?id=170successful merge of VNIR/ SWIR? + DEM or different combohttp://asterweb.jpl.nasa.gov/gallery-detail.asp?name=FogoL1A product -> misregistration of VNIR and SWIR, solved with L1B
Longyearbyen, Svalbard,Norway The perspective view was created by draping a simulated natural color image over an ASTER-derived digital elevation model. The image was acquired July 12, 2003, and is located at 78.2 degrees north latitude, 15.6 degrees east longitude. Longyearbyen is the world’s northernmost town
www.mapplace.ca - BC Ministry of Energy, Mines and Petroleum Resources 100 anaglyph scene images created and available online
North Coast Mountains, BC N The vertical image (bands 1,2,3) was orthorectified and coloured. The 3B image was left grey and was not orthorectified. When combined into the anaglyph image we manually adjusted them to get a reasonable relief. Colours were designed to maximise geological contrasts.
Chapman Glacier, Canadahttp://asterweb.jpl.nasa.gov/gallery-detail.asp?name=Chapman
GLIMS: Global Land Ice Measurements from Space • Goal is to determine the extent of world’s glaciers and the rate at which they are changing. • Acquire global set of ASTER images • Map global extent of land ice • Analyze interannual changes in length, area, surface flow fields • Over 60 institutions participating
Monitoring changes in glaciers and glacier lakes Tibet Himalaya Bhutan Himalaya Image is a portion of an uncalibrated ASTER Level 1A VNIR false-color image (321RGB), acquired on November 20, 2001
Monitoring Supraglacial and ProglacialLakes Lugge Tsho Thorthomi Tsho Raphsthreng Tsho N 2 kilometers The stagnating termini of glaciers in the Bhutan Himalaya. Glacial lakes have been rapidly forming on the surfaces of debris-covered glaciers worldwide during the last few decades. Image is a portion of an uncalibrated ASTER Level 1A VNIR false-color image (321RGB), acquired on November 20, 2001
Tsho Rolpa, Nepal • Quickly forming supragla- cial lake with natural dam at glacier’s unstable terminal moraine. • Mitigation plans developed • in years before disaster was imminent. • Emergency drainage con-duit constructed just in time to circumvent disaster. Images from brochures of the International Centre for Integrated Mountain Development, Kathmandu
Himalaya, north-south asymmetry in flow speed found by autocorrelating two ASTER images ASTL1B RGB A. Kääb / University of Zurich
Animation: 2000-2001http://www.geo.unizh.ch/~kaeaeb/glims/glims.html
Glacier elevation differencing: Topo 1970 - ASTER 2002 Contours – 50metres
Automated delineation of debris-covered glaciers based on ASTER dataTobias Bolch, Manfred F. Buchroithner, Andre KunertInstitute for Cartography, Technische Universita¨t Dresden, D-01062 Dresden, Germany
Using topographic variables to map debris-covered icealong with thermal channels
Glacier Mapping in High Mountains Using DEMs, Landsat and ASTERDataTobias Bolch (1) and Ulrich Kamp (2)(1) Dresden University of Technology, Germany (2) The University of Montana, U.S.A. ASTER DEMs review: http://portal.acm.org/citation.cfm?id=1451068.1451069&coll=&dl=ACM
ASTER Update SWIR bands unusable as of October 2008 Archive is 1,500,000 scenes growing at 500 / day Continuing free downloads (for us) ‘Global DEM’ available spring 2009 to 83 degrees N/S
Kizimen Volcano, Kamchatka Feb 25, 2011 http://asterweb.jpl.nasa.gov/gallery-detail.asp?name=kizimen