Download
1 / 4
40 likes | 58 Views
Explore the evolution of monetary policy and financial stability policy post-financial crisis, distinguishing their objectives, instruments, and authority. Svensson advocates for a flexible inflation targeting approach with a focus on financial conditions. Discover alternative policy-rate paths and the importance of not targeting housing prices with monetarist approaches. Uncover strategies for handling financial stability via comparative advantage principles.

E N D
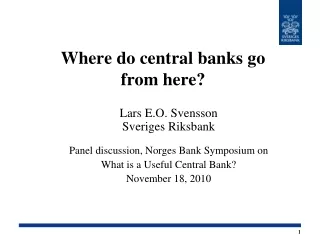
Where do central banks go from here? Lars E.O. SvenssonSveriges Riksbank Panel discussion, Norges Bank Symposium on What is a Useful Central Bank? November 18, 2010 1
Background • The financial crisis was caused by other factors than monetary policy • MP and financial-stability policy (FSP) are distinct and different – it was FSP that failed, not MP • FSP and MP: Distinguish according to (1) objectives, (2) instruments, and (3) authority in charge • Financial stability (FS) as an objective of MP makes little sense – but makes sense as an objective of the central bank, if the central bank has the suitable instruments
Monetary policy after the crisis Flexible inflation targeting (FIT) is fine – before, during, and after the crisis But greater role for financial conditions in transmission mechanism FS may imply restrictions on MP – rare event Normally, handle FS w/ FSP, not w/ MP (principle of comparative advantage) Do not use MP to target housing prices FIT with mean squared gaps (MSGs) – another step towards increased transparency
Alternative policy-rate paths Percent, quarterly averages CPI-ATE Annual percentage change 8,0 3,0 6,0 2,0 4,0 1,0 2,0 0,0 0,0 02 03 04 05 06 07 08 02 03 04 05 06 07 08 Mean squared gaps Output gap Percent 2,0 4,0 1,5 Low 2,0 Output 1,0 Main 0,0 0,5 High 0,0 -2,0 0,0 0,5 1,0 1,5 2,0 02 03 04 05 06 07 08 CPI-ATE Monetary policy with mean squared gapsNorges Bank, March 2005