Download
1 / 17
170 likes | 268 Views
Explore stock and flow of liver transplants from 1993-2005, including patient demographics, survival rates, and causes of death. Data tables and figures provided.

E N D
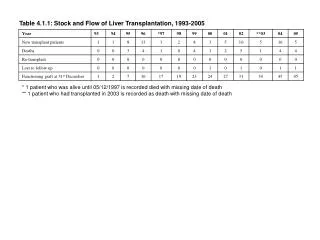
Table 4.1.1: Stock and Flow of Liver Transplantation, 1993-2005 * 1 patient who was alive until 05/12/1997 is recorded died with missing date of death ** 1 patient who had transplanted in 2003 is recorded as death with missing date of death
New patients Alive at 31st Dec 50 45 40 35 30 Number of patients 25 20 15 10 5 0 1993 1995 1997 1999 2001 2003 2005 1994 1996 1998 2000 2002 2004 Year Figure 4.1.1: Stock and Flow of Liver Transplantation, 1993-2005
Table 4.1.3: Centres for Liver transplantation, 1993-2005 * Data was not reported.
Table 4.1.4: Distribution of Centres of Follow-up of Transplant Recipients, 2005 * Follow-up data was not reported.
Male Female 10 8 6 Number of patients 4 2 0 1993 1995 1997 1999 2001 2003 2005 1994 1996 1998 2000 2002 2004 Year Table 4.2.1: Gender distribution, 1993-2005 Figure 4.2.1: Gender distribution, 1993-2005
Malay Chinese Indian Others 12 10 8 Number of patients 6 4 2 0 1993 1995 1997 1999 2001 2003 2005 1994 1996 1998 2000 2002 2004 Year Table 4.2.2: Ethnic group distribution, 1993-2005 Figure 4.2.2: Ethnic group distribution, 1993-2005
Table 4.2.3: Age distribution, 1993-2005 * Age=date of transplant – date of birth
Table 4.2.4: Primary diagnosis, 1993-2005 (N=80) *5 patients have more than one primary disease
Table 4.2.5: Indication for Transplantation, 1993-2005 (N=80) *15 patients had 1 indication for transplantation, 61 had more than 1 indication for transplantation
Table 4.3.1: Type of transplant, 1993-2005 (N=80) * 1 patient is Living related - Other
Table 4.3.2: Immunosuppressive drug treatment at transplantation, 1993-2005 (N=80) * 21 patients had 1 type of drug, 37 patients had 2 types, 9 patients had 3 types
1.00 0.75 0.50 0.25 0.00 0 2 4 6 8 10 12 Duration in months Year 1993-1998 Year 1999-2005 Table 4.4.1: Patient survival by year of transplant, 1993-2005 (N=80) SE=standard error Figure 4.4.1: Patient survival by year of transplant, 1993-2005
1.00 0.75 0.50 Cumulative survival 0.25 0.00 0 2 4 6 8 10 12 Duration in months Male Female Table 4.4.2: Patient survival by gender, 1993-2005 (N=80) SE=standard error Figure 4.4.2: Patient survival by gender, 1993-2005
1.00 0.75 Cumulative survival 0.50 0.25 0.00 0 2 4 6 8 10 12 Duration in months 0-9 years >=10 years Table 4.4.3: Patient survival by age group, 1993-2005 (N=80) SE=standard error Figure 4.4.3: Patient survival by age group, 1993-2005
Table 4.4.4: Causes of death, 1993-2005 (N=80) * 2 patients with no date of death