Download
1 / 44
480 likes | 985 Views
Learn about representing motion in physics, including straight-line motion, motion diagrams, and coordinate systems. Understand motion in terms of displacement and vectors versus scalars.

E N D
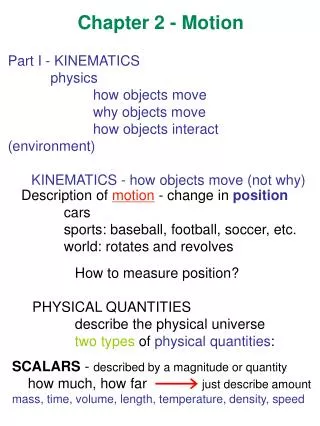
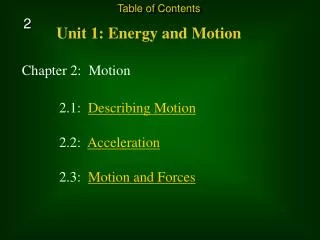
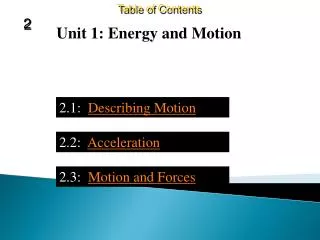
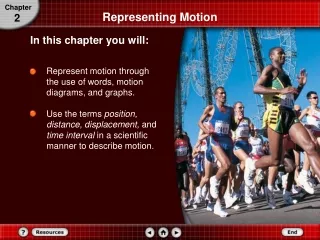
PHYSICS Principles and Problems Chapter 2: Representing Motion
Picturing Motion SECTION2.1 All Kinds of Motion • Straight-line motion follows a path directly between two points without turning left or right. • Ex. Forward and backward, up and down, or north and south. • A description of motion relates to place and time. You must be able to answer the questions of where and when an object is positioned to describe its motion.
Picturing Motion SECTION2.1 Motion Diagrams Click image to view movie.
Where and When? SECTION2.2 MAIN IDEA A coordinate system is helpful when you are describing motion. • What is a coordinate system? • How does the chosen coordinate system affect the sign of objects’ positions? • How are time intervals measured? • What is displacement? • How are motion diagrams helpful in answering questions about an object’s position or displacement? Essential Questions
Where and When? SECTION2.2 Coordinate Systems • A coordinate system tells you the location of the zero point of the variable you are studying and the direction in which the values of the variable increase. • The origin is the point at which both variables have the value zero.
Where and When? SECTION2.2 Coordinate Systems (cont.) • In the example of the runner, the origin, represented by the zero end of the measuring tape, could be placed 5 m to the left of the tree.
Where and When? SECTION2.2 Coordinate Systems (cont.) • You can indicate how far away an object is from the origin at a particular time on the simplified motion diagram by drawing an arrow from the origin to the point representing the object, as shown in the figure.
Where and When? SECTION2.2 Coordinate Systems (cont.) • The two arrows locate the runner’s position at two different times. • Because the motion in the figure below is in one direction, the arrow lengths represent distance.
Where and When? SECTION2.2 Coordinate Systems (cont.) • The length of how far an object is from the origin indicates its distancefrom the origin.
Where and When? SECTION2.2 Coordinate Systems (cont.) • A position 9 m to the left of the tree, 5 m left of the origin, would be a negative position, as shown in the figure below.
Where and When? SECTION2.2 Vectors and Scalars • Quantities that have both size, also called magnitude, and direction, are called vectors, and can be represented by arrows. • Vector quantities will be represented by boldface letters. • Quantities that are just numbers without any direction, such as distance, time, or temperature, are called scalars. • Scalars quantities will be represented by regular letters.
Where and When? SECTION2.2 Vectors and Scalars (cont.) • The difference between the initial and the final times is called the time interval.
Where and When? SECTION2.2 Vectors and Scalars (cont.) • The common symbol for a time interval is ∆t, where the Greek letter delta, ∆, is used to represent a change in a quantity.
Where and When? SECTION2.2 Vectors and Scalars (cont.) • The time interval is defined mathematically as follows: • Although i and f are used to represent the initial and final times, they can be initial and final times of any time interval you choose. • The time interval is a scalar because it has no direction.
The figure below shows the position of the runner at both the tree and the lamppost. These arrows have magnitude and direction. Position is a vector with the arrow’s tail at the origin and the arrow’s tip at the place. Where and When? SECTION2.2 Vectors and Scalars (cont.)
The symbol x is used to represent position vectors mathematically. Xirepresents the position at the tree, xf represents the position at the lamppost and ∆x, represents the change in position, displacement, from the tree to the lamppost. Where and When? SECTION2.2 Vectors and Scalars (cont.)
Displacement is defined mathematically as: Remember that the initial and final positions are the start and end of any interval you choose, so a plus and minus sign might be used to indicate direction. Where and When? SECTION2.2 Vectors and Scalars (cont.) ∆d = df - di
Where and When? SECTION2.2 Vectors and Scalars (cont.) • A vector that represents the sum o f two other vectors is called a resultant.
Position-Time Graphs SECTION2.3 Finding Positions Click image to view movie.
Position-Time Graphs SECTION2.3 Finding Positions (cont.) • Graphs of an object’s position and time contain useful information about an object’s position at various times. It can be helpful in determining the displacement of an object during various time intervals.
Position-Time Graphs SECTION2.3 Finding Positions (cont.) • The data in the table can be presented by plotting the time data on a horizontal axis and the position data on a vertical axis, which is called a position-time graph.
Position-Time Graphs SECTION2.3 Finding Positions (cont.) • To draw the graph, plot the object’s recorded positions. Then, draw a line that best fits the recorded points. This line represents the most likely positions of the runner at the times between the recorded data points. • The symbol x represents the instantaneous position of the object—the position at a particular instant.
Position-Time Graphs SECTION2.3 Multiple Objects on a Position-Time Graph In the graph, when and where does runner B pass runner A?
Position-Time Graphs SECTION2.3 Multiple Objects on a Position-Time Graph (cont.) B passes A about 190 m beyond the origin, 45.0 s after A has passed the origin.
Section Check SECTION2.3 A position-time graph of an athlete winning the 100-m run is shown. What was the instantaneous position of the athlete at 2.5 s? A. 15 m B. 20 m C.25 m D. 30 m
Section Check SECTION2.3 From the following position-time graph of two brothers running a 100-m dash, at what time do both brothers have the same position? The smaller brother started the race from the 20-m mark.
Section Check SECTION2.3 Answer Reason: The two brothers meet at 6 s. In the figure, we find the intersection of lines representing the motion of one brother with the line representing the motion of other brother. These lines intersect at 6 s and at 60 m.
How Fast? SECTION2.4 Velocity and Speed • Suppose you recorded two joggers in one motion diagram, as shown in the figure below. The position of the jogger wearing red changes more than the of the jogger wearing blue • For a fixed time, the magnitude of the displacement (∆x), is greater for the jogger in red. • If each jogger travels 100m, the time interval (∆t)would be smaller for the jogger in red.
How Fast? SECTION2.4 Velocity and Speed (cont.) • The slopes of the two lines are found as follows: • A greater slope, shows that the red jogger traveled faster.
How Fast? SECTION2.4 Velocity and Speed (cont.) • The unit of the slope is meters per second. In other words, the slope tells how many meters the runner moved in 1 s. • The slope is the change in position, divided by the time interval during which that change took place, or (xf - xi) / (tf - ti), or Δx/Δt. • When Δx gets larger, the slope gets larger; when Δt gets larger, the slope gets smaller.
How Fast? SECTION2.4 Velocity and Speed (cont.) • The slope of a position-time graph for an object is the object’s average velocity and is represented by the ratio of the change of position to the time interval during which the change occurred. Δx (xf - xi) Average Velocity ≡_______ = ________ Δt (tf - ti) • The symbol ≡ means that the left-hand side of the equation is defined by the right-hand side.
How Fast? SECTION2.4 Velocity and Speed (cont.) • The object moves in the negative direction at a rate of 5.0 m/s.
How Fast? SECTION2.4 Velocity and Speed (cont.) • The slope’s absolute value is the object’s average speed,5.0m/s, which is the distance traveled divided by the time taken to travel that distance.
How Fast? SECTION2.4 Velocity and Speed (cont.) The graph describes the motion of a student riding his skateboard along a smooth, pedestrian-free sidewalk. What is his average velocity? What is his average speed?
How Fast? SECTION2.4 Velocity and Speed (cont.) Step 1: Analyze and Sketch the Problem Identify the coordinate system of the graph.
How Fast? SECTION2.4 Velocity and Speed (cont.) Find the average velocity using two points on the line. Use magnitudes with signs indicating directions. Δx = _____ Δt (xf - xi) = ______ (tf - ti)
How Fast? SECTION2.4 Velocity and Speed (cont.) Substitute x2 = 12.0 m, x1 = 6.0 m, t2 = 8.0 s, t1 = 4.0 s:
How Fast? SECTION2.4 Velocity and Speed (cont.) Are the units correct? m/s are the units for both velocity and speed. Do the signs make sense? The positive sign for the velocity agrees with the coordinate system. No direction is associated with speed.
How Fast? SECTION2.4 Equation of Motion • Using the position-time graph used before with a slope of -5.0m/s, remember that you can represent any straight line with the equation, y = mx + b. • y is the quantity plotted on the vertical axis, m is the line’s slope, x is the quantity plotted on the horizontal axis and b is the line’s y-intercept.
How Fast? SECTION2.4 Equation of Motion (cont.) • Based on the information shown in the table, the equation y = mx + b becomes x = t + xi, or, by inserting the values of the constants, x = (–5.0 m/s)t + 20.0 m. • You cannot set two items with different units equal to each other in an equation.
How Fast? SECTION2.4 Equation of Motion (cont.) • An object’s position is equal to the average velocity multiplied by time plus the initial position. • This equation gives you another way to represent the motion of an object.
Section Check SECTION2.4 The position-time graph of a car moving on a street is given here. What is the average velocity of the car? A. 2.5 m/s B. 5 m/s C. 2 m/s D. 10 m/s
Section Check SECTION2.4 Answer Reason:The average velocity of an object is the slope of a position-time graph.