Prediction-based Threshold for Medication Alert
Prediction-based Threshold for Medication Alert. Yoshimasa Kawazoe 1 M.D., Ph.D., Kengo Miyo 1,2 Ph.D., Issei Kurahashi 2 Ph.D., Ryota Sakurai 1 M.D. Kazuhiko Ohe 1,2 M.D., Ph.D. 1) Department of Planning, Information and Management, The University of Tokyo Hospital

Prediction-based Threshold for Medication Alert
E N D
Presentation Transcript
Prediction-based Threshold for Medication Alert Yoshimasa Kawazoe1 M.D., Ph.D., Kengo Miyo1,2 Ph.D., Issei Kurahashi2 Ph.D., Ryota Sakurai1 M.D. Kazuhiko Ohe1,2M.D., Ph.D. 1) Department of Planning, Information and Management, The University of Tokyo Hospital 2) Department of Medical Informatics and Economics, School of Medicine, The University of Tokyo
Alerting systems with CPOE • Static threshold: • Easily available, and commonly used in CPOE. • Medication doses occasionally exceed as a result of taking a patient’s conditions into account. • It may lead physician's alert fatigue. • Rule based threshold: • “IF serum-creatinine > 2.5mg/dl & candesartan dose > 8 mg THEN“ • Rule-based approach has problem with cost and maintenance, because of complexity and comprehensivenessof the rule building for thousands of drugs. Traditional ways providing alerts for excessive dose
Make the most of past medication record Hypothesis • If we can estimate a dose of medication according to the patient similarity, it seems to be reasonable to set an alert threshold based on the estimated dose, because similar medication for a similar patient must be safest one. • If the patient similarity is measured by their demographics and registered diseases, we can develop a prediction model of a medication dose using these features, and CPOE can compute the threshold based on the prediction model at the time of a medication.
Prediction-based thresholds Materials and Methods • Collecting medication record: • Eight frequently alerted drugs (Carvedilol, Pravastatine, ..etc) • Health insurance claims for 5 years. • Developing prediction models: • AppliedRandom Forests (RF) to estimate the medication dose. • Comparing theperformance of RF with Baggingand CART. • Showing variable importancemeasures features contributions. • Determining thresholds: • Applied boxplot for the RF predictions. • Comparing the boxplot’s thresholds with traditional static one.
1-1. Methods: Collecting medication records • Experiment settings • The University of Tokyo Hospital: 1,200 beds, 750,000 visits annually. • Insurance claims of inpatients and outpatients from Jan 2007 to Dec 2011. • Multiple medication records for the same patients prescribed during different visits or different days were allowed. Used 1500 out of 13000 diseases ranked by frequency
1-2. Methods: Why we used 1500 disease The distribution of frequency of the diseases The top 1500 types of diseases account for 90% of the total frequency 1 Hypertension 2 Diabetes 3 Hyperlipidemia Frequency of occurrence in the claims 13000 Mushroom poisoning 1500 Atheroma <= High Frequency Low Frequency => Types of diseases
2-1. Methods: Random Forest (L.Breiman, 1999) Decision Tree (CART) + Ensemble learning+ Random feature sampling Training Data Bootstrap sampling Sample 1 Sample 2 ・・ Sample N Developing CART with random feature sampling CART 1 CART 2 ・・・ CART N Prediction N ・・ Prediction 1 Prediction 2 Ensemble vote (majority / mean) Final prediction
2-2. Methods: Developing and evaluating the model Repeated increasing the number of the features (from 10 to 1500) For 8 Drugs Testing models 10000 records CF = 0.82 30000 Records Random Selection Actual dose Developing models 20000 records Predict dose Random Forest : 200 trees Decision Tree Ensemble learning Random Feature sampling Bagging : 200 trees Decision Tree Ensemble learning CART : Single tree Decision Tree
2-3. Results: Performance among the algorithms 0.51 0.89 correlation coefficient RF 0.68 Highest point at 200 features BAG CART 0.80 number of the features used 0.95 0.90 0.88 0.81
2-4. Results: Variable importance in RF (a feature’s contribution)
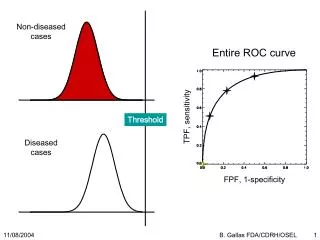
3-1. Methods: How to Determine thresholds Getting RF votes from the developed forest 1.5, 1.5, 2.0, 2.5, 2.5, 2.8, 3.2, 3.2, 3.5, 3.8, 4.2, 4.5, 5.5, 7.2,… Drawing a boxplot for the votes IQR 1.5×IQR Outlying! Highest Value (Threshold) Lower Quartile Upper Quartile Lowest Value 1 2 3 6 7 4 5
3-2. Results: Comparing thresholds - Carvedilol Among 10000 medications, 602 cases were detected by either or both of the thresholds 317 cases detected only by static thresholds 57 cases detected by both of the thresholds Dose (tablets) 228 cases detected only by proposed thresholds Thresholds for each medication record
Discussions 1 • Dose prediction based on patient similarity • The performances of RF prediction was high except for 2 drugs. • The patient similarity measured by the demographics and registered diseases are useful for estimation of medication dose. • Significance of the thresholds • We showed the proposed thresholds would reduce the alerts by a half of those when using the static thresholds. • Of course, merely discussing the increase or decrease in the number of alerts is not significant, we should discuss the trade-offs between what can be obtained and what can be lost. • However, our approach, which relies on past medications that were assured as appropriate for a patient’s condition, would have a certain level of evidence.
Discussions 2 • Advantages of the prediction thresholds • It can detect inappropriate medications even if the cases are under the static threshold. • In terms of adaptivity, our approach can be easily adopted in other hospitals because the health insurance claims that we used as the source for prediction model are commonly available. • Limitations • We need to clarify how many prescription are enough to build the prediction model for applying the other drugs. • We also need to evaluate a physician's compliance for those alerts in the clinical setting while clarifying the outcomes responsible for those alerts.
Conclusions We presented a prediction-based approach to determine thresholds for the medication alert. Although the significance of the thresholds should be discussed in different ways, our approach, which relies on physicians’ collective experiences, had some practical advantages. In future work, we should evaluate a physician's compliance for those alerts in a clinical setting.
Thank you! contact: kawazoe-tky@umin.ac.jp