Download
1 / 22
240 likes | 451 Views
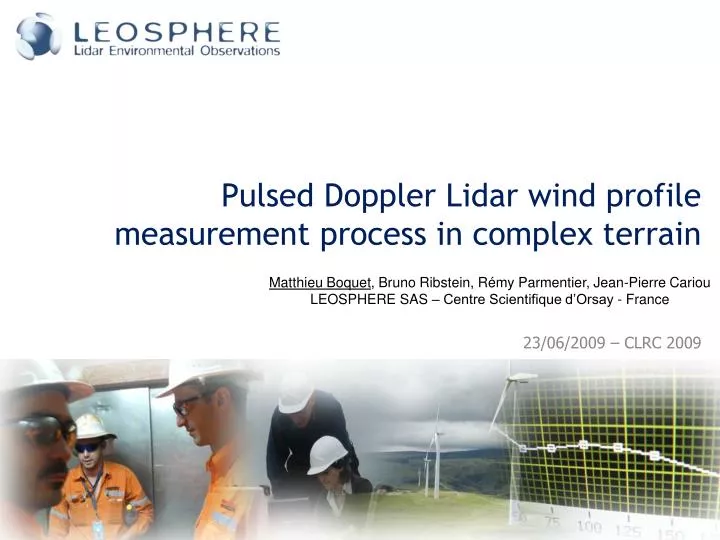
Pulsed Doppler Lidar wind profile measurement process in complex terrain. Matthieu Boquet , Bruno Ribstein , Rémy Parmentier, Jean-Pierre Cariou LEOSPHERE SAS – Centre Scientifique d’Orsay - France. Agenda. Pulsed Lidar volume measurement principle Simple & complex terrain

E N D
Pulsed Doppler Lidar wind profilemeasurement process in complex terrain Matthieu Boquet, Bruno Ribstein, Rémy Parmentier, Jean-Pierre Cariou LEOSPHERE SAS – Centre Scientifique d’Orsay - France
Agenda • Pulsed Lidar volume measurement principle • Simple & complex terrain • CFD modeling example • Optimization • Conclusions
Pulsed Lidar principle How Does the WindCubeTM retrieve wind Velocity vertical profiles?
Volume measurement aerosols s=v.cos(a) • Radial velocity along a LOS • Pulse FWHM probed sample • Conically scanning • dc=height*tanθ • Sequentially scanning • 4sec complete rotation a v q Laser shooting direction
Wind velocity vertical profile • 4 radial velocities 3 wind velocity components • Hypothesis: • Same wind inside the probed volume • Same wind at the 4 probed domains • Stationary atmosphere • Comparison with anemometers point measurement
Terrain influence How WELL DOES the WindCubeTM retrieve wind Velocity vertical profiles?
Flat terrain • Inferior to 1% relative difference between Lidar and cup anemometer
Forested area and gentle slope • About -2% relative difference between Lidar and sonic anemometer Terrain slope over 10° WindCubeTM Forest
Mountainous terrain • About -5% relative difference between Lidar and cup anemometer
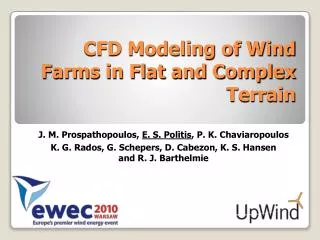
CFD Modeling analysis USING a cfd modeling of a complex terrain to better understand the lidar and anemometer differences?
CFD modeling • MERCURE/Aria Technologies software • Adapted to complex topography • Fine meshing • 2x2x1km box • ~10x10x5m cells • Stationary not a time variation study • Fair enough to study Lidar wind velocity retrieval process under various local complex flow • MatLab analysis • Lidar measurement process simulation
Spanish site North-Westwind WindCube Met mast North-Westwind
Wind distribution at 80m height North-westwind
Lidar vs. cup Underestimation <-5% Overestimation >5% North-West Wind
Back to the Lidar equations • Considering first order wind speed variation • Introducing wind speed gradient • θ being the zenithal angle, d=height*tanθ is the probed volume to center distance • In 2D:
Geometrical Optimisation How can we modify the lidar measurement process to get closer to cup?
Reducing the scanning cone • Probing a smaller volume then more homogeneous: • Often but not always true • Difference depends on altitude and vertical wind speed gradient • Other issue: smaller horizontal wind speed projection higher noise perturbation • No magical scanning cone angle • Dangerous below 15° and above 30°
30° vs. 15° • 30° • 15°
Multiplying the lines of sight • Consider vertical wind speed linear variations • A line of sight LOSi gives the radial velocity Si: With And Thus • No LOS brings info on Wi
Conclusion • Point and volume measurement • Vertical wind speed inhomogeneity • Scanning cone angle 15°-30° • More lines of sight are not more useful info • Experimental set up difficult
Thankyou www.leosphere.com