Download
1 / 27
290 likes | 433 Views
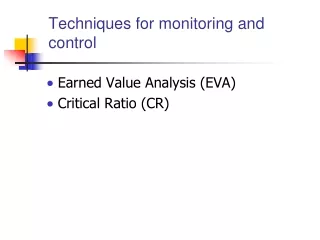
26 January 2011, Joint Research Centre, Bruxelles. Hyperspectral techniques for monitoring and verifying soil organic carbon stocks in croplands. Bas van Wesemael, Antoine Stevens & Marco Nocita. Context.

E N D
26 January 2011, Joint Research Centre, Bruxelles Hyperspectral techniques for monitoring and verifying soil organic carbon stocks in croplands Bas van Wesemael, Antoine Stevens & Marco Nocita
Context Agricultural practices are changing. Is it possible to verify changes in soil C as a result of such changes?
Context • What are the challenges for verifying changes in soil C at the field scale? • Large spatial variability and slow evolution of soil C over time • Large number of samples required to optimize sampling design and prove significant changes over time • Sampling and analysis are too costly for treating large number of samples (Smith, 2004) • Solution 1: fractions of soil C that change more quickly or more cost efficient techniques (Conant et al.,
Context • Solution 2: Increase number of observations using proximal techniques providing instant C, bulk density values in the field • Spectral techniques based on the reflectance of visible and near-infrared will be illustrated Proximal techniques in EU FP7 Digisoil: EM38, GPR, seismic, gamma spectrometry
Context VIS-NIR Spectroscopy • Principles of spectroscopy
Using the opticalproperties of a soil to determine the organiccarbon content (= proportion of the light reflected by the surface for a givenwavelength) Context VIS-NIR spectroscopy • Soil spectrum
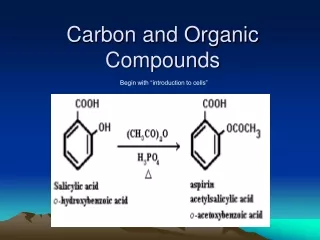
Context VIS-NIR Spectroscopy • Most compounds of organic matter have well defined spectral characteristics
± 1 % C ± 4 % C Context VIS-NIR spectroscopy • Influence of organic matter on the soil reflectance
field Context VIS-NIR Spectroscopy • Measuring the relectance • laboratory
Context VIS-NIR spectroscopy • Measuring the reflectance • Imaging spectroscopy
Context VIS-NIR Spectroscopy • How to measure the reflectance for large areas? • Imaging spectroscopy (other techniques: sensors pulled through the soil)
Context Spectro... Soil C monitoring • How to predictsoil C fromhyperspectral images? • Flight campaigns in Sept/Oct or March/April withsunnyweather and barefields (seedbedisideal) • Plough layer sampled • Analysis of soil C in the laboratory and development of statistical calibration model (Soil C = f(reflectancewli)) • Extrapolation of the model to all barefields in the image
Context Spectro... Soil C monitoring • Study area • N-S transect with different soil types: Cambisols, Luvisols, Arenosols & Calcisols • Images with the AHS-160 (63 spectral bands; 450 – 2500 nm; 2.5 m pixels) in autumn 2007 • Calibration samples > 300 • Validation samples > 100 • > 50 fields
Context Spectro... Soil C monitoring
Context Spectro... Soil C mapping • Global calibration model
Context Spectro... Soil C monitoring • Local models
Context Spectro... Soil C monitoring • SOC map for the bare fields in the flight line (600 km²): regional patterns
Context Spectro... Soil C monitoring
Context Spectro... Soil C monitoring
Context Spectro... Soil C monitoring Soil C verification
Context Spectro... Soil C monitoring Soil C verification Power analysis to calculate mean stock and minimum detectable difference (MDD) stock = 10*C * ρb * d * (1 – Rv) C hyperspectral ρ seismic profiling Rv ? Note: samples should be independent
Context Spectro... Soil C monitoring Soil C verification • Spatial dependence at various scales
Context Spectro... Soil C monitoring Soil C verification Validation of C measurements Soil C stock for the plough layer 0-20 cm Digisoil validation data set 36.6 ± 0.48 Mg C ha-1 30 samples Potential use of proximal techniques for C content, bulk density and stone content 35.5 ± 0.25 Mg C ha-1 107 effective samples
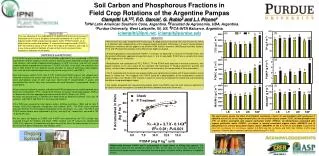
-10 -5 0 5 10 15 20 25 no-till Mg C per ha over 5 years reduced tillage Set-aside permanent crops deep rooted crops FYM straw sewage sludge compost improved rotations fertilisation irrigation biofuel crops extensification biological agriculture Minimum detectable difference 0.5 1.0 Freibauer et al., 2004
Context Spectro... Soil C monitoring & verification… Conclusions • Imaging spectroscopy allows detailed (2* 2m) monitoring of soil C in the plough layer of bare croplands in a large area • Airborne sensors (APEX, Hymap) cover flightlines of c. 10 by 60 km • Hyperspectral satellites (Hyperion) already exist although the resoltion is too low In progress: • Soil surface conditions (no vegetation, moisture content and roughness)
Context Spectro... Soil C monitoring & verification… Conclusions • Potential for Verification of small changes in soil C stock of a field by increasing the number of samples • In progress: • Imagery will be combined with profiling to capture the vertical C gradient • Modelling of lateral and vertical soil C distribution instead of ‘power analysis’ • Fusion with other proximal techniques provides spatial data on bulk density (e.g. seismic profiling) and stone content
Partners • Département des Sciences • et Gestion de l’Environnement Funding