Download
1 / 48
550 likes | 885 Views
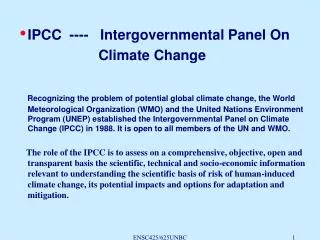
IPCC ---- Intergovernmental Panel On Climate Change

E N D
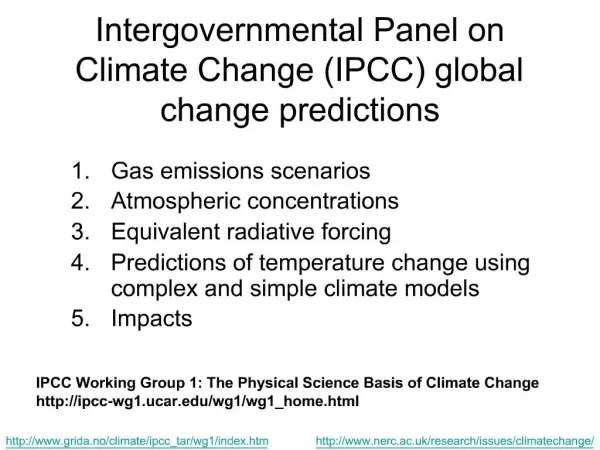
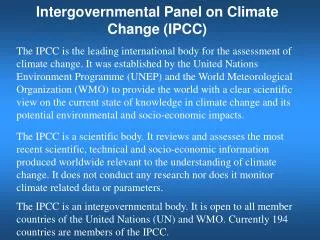
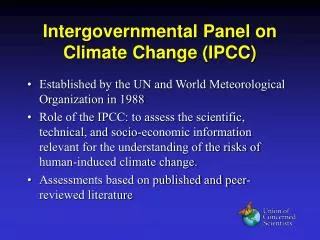
IPCC ---- Intergovernmental Panel On Climate Change Recognizing the problem of potential global climate change, the World Meteorological Organization (WMO) and the United Nations Environment Program (UNEP) established the Intergovernmental Panel on Climate Change (IPCC) in 1988. It is open to all members of the UN and WMO. The role of the IPCC is to assess on a comprehensive, objective, open and transparent basis the scientific, technical and socio-economic information relevant to understanding the scientific basis of risk of human-induced climate change, its potential impacts and options for adaptation and mitigation. ENSC425/625UNBC
IPCC: first assessment report in 1990 second assessment report in 1995 third assessment report in 2001 fourth assessment report in 2007 ENSC425/625UNBC
IPCC reports should be the most authoritative reports on climate change, and are widely cited in almost any debate related to climate change. The reports have been influential in forming national and international responses to climate change. A small but vocal minority (less than 1.5%) of the scientists involved with the report have accused the IPCC of bias. ENSC425/625UNBC
Atmospheric concentrations of carbon dioxide, methane and nitrous oxide over the last 10,000 years (large panels) and since 1750 (inset panels). Measurements are shown from ice cores (symbols with different colours for different studies) and atmospheric samples (red lines). The corresponding radiative forcings are shown on the right hand axes of the large panels. {Figure 6.4} ENSC425/625UNBC
Global atmos. concentrations of carbon dioxide, methane and nitrous oxide have increased markedly as a result of human activities since 1750 and now far exceed pre-industrial values determined from ice cores spanning many thousands of years. The global increases in carbon dioxide concentration are due primarily to fossil fuel use and land use change, while those of methane and nitrous oxide are primarily due to agriculture. - IPCC report. ENSC425/625UNBC
LOSU: assessed level of scientific understanding ENSC425/625UNBC
The understanding of anthropogenic warming and cooling influences on climate has improved since the TAR, leading to very high confidence that the global average net effect of human activities since 1750 has been one of warming. --- IPCC report. Very high: at least 90% correct High: at least 80% correct TAR: Third assessment report (2001). ENSC425/625UNBC
Observed changes in (a) global average surface temperature, (b) global average sea level from tide gauge (blue) and satellite (red) data and (c) Northern Hemisphere snow cover for March-April. All changes are relative to corresponding averages for the period 1961–1990. Smoothed curves represent decadal average values while circles show yearly values. The shaded areas are the uncertainty intervals estimated from a comprehensive analysis of known uncertainties (a and b) and from the time series (c). {FAQ 3.1, Figure 1, Figure 4.2, Figure 5.13} ENSC425/625UNBC
Warming of the climate system is unequivocal, as is now evident from observations of increases in global average air and ocean temperatures, widespread melting of snow and ice, and rising global average sea level. ENSC425/625UNBC
At continental, regional and ocean basin scales, numerous long-term changes in climate have been observed. These include changes in arctic temperature and ice, widespread changes in precipitation amounts, ocean salinity, wind patterns and aspects of extreme weather including droughts heavy precipitation, heat waves and the intensity of tropical cyclones. --- IPCC report ENSC425/625UNBC
TAR: likely; FAR: very likely ENSC425/625UNBC
Comparison of observed continental- and global-scale changes in surface temperature with results simulated by climate models using natural and anthropogenic forcings. Decadal averages of observations are shown for the period 1906 to 2005 (black line) plotted against the centre of the decade and relative to the corresponding average for 1901–1950. Lines are dashed where spatial coverage is less than 50%. Blue shaded bands show the 5–95% range for 19 simulations from five climate models using only the natural forcings due to solar activity and volcanoes. Red shaded bands show the 5–95% range for 58 simulations from 14 climate models using both natural and anthropogenic forcings. {FAQ 9.2, Figure 1} ENSC425/625UNBC
Projections of future climate change GCMs use a transient climate simulation to project/predict future temperature changes under various scenarios. These can be idealized scenarios (most commonly, CO2 increasing at 1%/y). ENSC425/625UNBC
equilibrium climate simulation greenhouse gas concentrations are suddenly changed (typically from pre-industrial values to twice pre-industrial values) and the model allowed to come into equilibrium with the new forcing. • transient climate simulation a mode of running a global climate model in which a period of time (typically 1850-2100) is simulated with continuously-varying concentrations of greenhouse gases so that the climate of the model represents a realistic mode of possible change in the real world. ENSC425/625UNBC
The 21st century predicted by the HadCM3 climate model (one of those used by the IPCC) if a business-as-usual scenario is assumed for economic growth and greenhouse gas emissions. The average warming predicted by this model is 3.0°C. ENSC425/625UNBC
Time evolution of globally averaged temperature change relative to the period 1961-1990. The top graph shows the results of greenhouse gas forcing, the bottom graph shows the results of greenhouse gas forcing plus aerosol forcing. ENSC425/625UNBC
Time evolution of globally averaged precipitation change relative to the period 1961-1990. The top graph shows the results of greenhouse gas forcing, the bottom graph shows the results of greenhouse gas forcing plus aerosol forcing. ENSC425/625UNBC
SRES: the IPCC special report on Emission scenarios ENSC425/625UNBC
Uncertainties in climate prediction • (1) Climate models are still failing to take into account all the detailed aspects of clouds. Clouds: composed of water vapor => greenhouse gas => incr. T block sunlight => decr. T There is no clear consensus on the exact way climate change will modify these two antagonist effects in the future, because clouds are not explicitely taken into account in present climate models. (2) The future climate (say 2100) not only depends on the amount of greenhouse gases that we already have put in the atmosphere, but also, and mainly, of the amount we are about to put from now on until 2100. That's why scientists use emission scenarios, that each describes how greenhouse gases emissions could evolve between 2000 and 2100, depending on various hypothesis. ENSC425/625UNBC
A1 Family is based on the following hypothesis • Rapid economic growth. • A global population that reaches 9 billion in 2050 and then gradually declines. • The quick spread of new and efficient technologies. • A convergent world - income and way of life converge between regions. Extensive social and cultural interactions worldwide. • There are subsets to the A1 family based on their technological emphasis: • A1FI - An emphasis on fossil-fuels. • A1B - A balanced emphasis on all energy sources. • A1T - Emphasis on non-fossil energy sources. Btoe: billion ton of oil equivalent. ENSC425/625UNBC
A2 family • The A2 scenarios are of a more divided world. The A2 family of scenarios is characterized by: • A world of independently operating, self-reliant nations. • Continuously increasing population. • Regionally oriented economic development. • Slower and more fragmented technological changes and improvements to per capita income. ENSC425/625UNBC
B1 Family • The B1 scenarios are of a world more integrated, and more ecologically friendly. The B1 scenarios are characterized by: • Rapid economic growth as in A1, but with rapid changes towards a service and information economy. • Population rising to 9 billion in 2050 and then declining as in A1. • Reductions in material intensity and the introduction of clean and resource efficient technologies. • An emphasis on global solutions to economic, social and environmental stability. Btoe: billion ton of oil equivalent. ENSC425/625UNBC
B2 Family • The B2 scenarios are of a world more divided, but more ecologically friendly. The B2 scenarios are characterized by: • Continuously increasing population, but at a slower rate than in A2. • Emphasis on local rather than global solutions to economic, social and environmental stability. • Intermediate levels of economic development. • Less rapid and more fragmented technological change than in B1 and A1. ENSC425/625UNBC
Between the most "optimistic" and the most "pessimistic" of these scenarios, there is : • a factor 5 regarding CO2 emissions in 2100, which reflects the wide range of hypothesis made on demography, material consumption (that determines energy consumption, except for energy efficiency), the energy mix (that is the proportion of each source in the total), etc • a factor 2 regarding methane emissions in 2100 (not shown), and a 50% difference regarding the N2O emissions in 2100 (not shown either). • a factor 3 regarding SO2 emissions in 2100. SO2 is a good marker of local (or "classical") industrial pollution, and is an aerosol precursor, or a "climate cooler". ENSC425/625UNBC
Solid lines are multi-model global averages of surface warming (relative to 1980–1999) for the scenarios A2, A1B and B1, shown as continuations of the 20th century simulations. Shading denotes the ±1 standard deviation range of individual model annual averages. The orange line is for the experiment where concentrations were held constant at year 2000 values. The grey bars at right indicate the best estimate (solid line within each bar) and the likely range assessed for the six SRES marker scenarios. The assessment of the best estimate and likely ranges in the grey bars includes the AOGCMs in the left part of the figure, as well as results from a hierarchy of independent models and observational constraints. {Figures 10.4 and 10.29} ENSC425/625UNBC
Monsoon: precipitation (Ch. 10 – IPCC) Multi-model mean changes in surface air temperature (°C, left), precipitation (mm day–1, middle) and sea level pressure (hPa, right) for boreal winter (DJF, top) and summer (JJA, bottom). Changes are given for the SRES A1B scenario, for the period 2080 to 2099 relative to 1980 to 1999. Stippling denotes areas where the magnitude of the multi-model ensemble mean exceeds the inter-model standard deviation. Results for individual models can be seen in the Supplementary Material for this chapter. ENSC425/625UNBC
Multi-model mean of annual mean surface warming (surface air temperature change, °C) for the scenarios B1 (top), A1B (middle) and A2 (bottom), and three time periods, 2011 to 2030 (left), 2046 to 2065 (middle) and 2080 to 2099 (right). Stippling is omitted for clarity (see text). Anomalies are relative to the average of the period 1980 to 1999. Results for individual models can be seen in the Supplementary Material for this chapter. ENSC425/625UNBC
A global warming will be more rapid over land than over the oceans, the continental –scale land-sea thermal contrast will become larger in summer and smaller in winter => a simple idea is that the summer monsoon will be stronger and the winter monsoon will be weaker in the future than the present. • However 15 models results show a weakening of Hadley cell, Walker cell and monsoon circulation by 9%, 8% and 14%, respectively, by the late 21st century. This is because that pronounced warming over the tropics results in a reduction in the meridional thermal gradients between the Asian continent and adjacent oceans. ENSC425/625UNBC
Mean Tropical Pacific Climate Change • Greenhouse gas => SST increase but not spatially uniform due to a general reduction in tropical circulations in a warm climate. Actually SST increase more over the eastern tropical Pacific than over the western tropical Pacific => decrease SLP gradient along the equator and an eastward shift of the tropical Pacific rainfall distribution. an En Nino-like mean state. ENSC425/625UNBC
El Nino The change in El Niño variability (vertical axis) is denoted by the ratio of the standard deviation of the first EOF of sea level pressure (SLP) between the current climate and in the future, ENSC425/625UNBC
El Nino (Ch. 10 – IPCC) • Changes in ENSO interannual variability differ from model to model. There is no statistically significant changes in the amplitude or frequency of ENSO variability in the future. ENSC425/625UNBC
Thermohaline Circulation (Meridional Overturning circulation (MOC).) • The increase in greenhouse gases in the atmosphere leads to decrease of the density of the surface waters in the North Atlantic due to warming or a reduction in salinity, the strength of the MOC is decreased. • There is still a large spread among the models simulated reduction in the MOC, ranging from no response to a reduction of over 50% by the end of the 21st century. ENSC425/625UNBC
If Emissions of Greenhouse gases are reduced, how quickly do their concentration in the atmosphere decrease? Simulated changes in atm. CO2 concen. relative to the present-day for emission stabilized at the current level (black), or at 10% (red); 30% (green)… lower than the present level. ENSC425/625UNBC
Accuracy of models that predict global warming: (1) albedo errors (2) external factors not taken into consideration (3) model resolution (4) initial conditions (5) the role of clouds on climate changes ENSC425/625UNBC
Evidence of some uncertainties: (1) The individual models often exhibit worse agreement with observations. (2) All models have shortcomings in their simulations of the present day climate of the stratosphere, which might limit the accuracy of predictions of future climate change. (3) There are problems in simulating natural seasonal variability. (4) Coupled climate models do not simulate with reasonable accuracy clouds and some related hydrological processes. ENSC425/625UNBC
Evidence of model reliability: (1) The model mean exhibits good agreement with observations. (2) Surface air temperature is particularly well simulated. (3) For nearly all models the r.m.s. error in zonal- and annual-mean surface air temperature is small compared with its natural variability. ENSC425/625UNBC
Conclusion ============= The majority of climatologists agree that important climate processes are imperfectly accounted for by the climate models but don't think that better models would change the conclusion. ENSC425/625UNBC