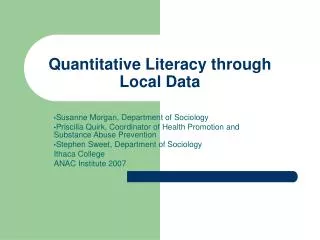
Quantitative Literacy through Local Data
Quantitative Literacy through Local Data. Susanne Morgan, Department of Sociology Priscilla Quirk, Coordinator of Health Promotion and Substance Abuse Prevention Stephen Sweet, Department of Sociology Ithaca College ANAC Institute 2007. Combining Good Things. Quantitative Literacy is Good

Quantitative Literacy through Local Data
E N D
Presentation Transcript
Quantitative Literacy through Local Data Susanne Morgan, Department of Sociology Priscilla Quirk, Coordinator of Health Promotion and Substance Abuse Prevention Stephen Sweet, Department of Sociology Ithaca College ANAC Institute 2007
Combining Good Things • Quantitative Literacy is Good • Integrating Data Analysis is Good • Using Local Data is Good • Analyzing Health Issues is Good • Cross-Divisional Collaboration is Good
“Real” Mathematics Geometry, Algebra, Trigonometry, Calculus, etc. Math as a purpose unto itself. Principles to be studied, dismantled, and synthesized. Absolute precision is expected Quantitative Literacy The blending of mathematical tools with linguistic constructs Application of mathematical reasoning to consider the workings of the natural and social worlds Math-Lite? Pragmatic acceptance of imprecision Reliance on “black boxes” Vocational and extra-vocational applications The Two Mathematics Sources: Madison, Bernard. 2004. “Two Mathematics: Ever the Twain Shall Meet? Peer Review 6:9-12. Sweet, Stephen and Kerry Strand. 2006. Cultivating Quantitative Literacy: The Role of Sociology. Teaching Sociology 34: 1-4.
“Real” Mathematics Geometry, Algebra, Trigonometry. Calculus, etc. Math as a purpose unto itself. Principles to be studied, dismantled, & synthesized. Absolute precision is expected Quantitative Literacy The blending of mathematical tools with linguistic constructs Application of mathematical reasoning to consider the workings of the natural and social worlds Math-Lite? Pragmatic acceptance of imprecision Reliance on black boxes Vocational & extra vocational applications The Two Mathematics Sources: Madison, Bernard. 2004. “Two Mathematics: Ever the Twain Shall Meet? Peer Review 6:9-12. Sweet, Stephen and Kerry Strand. 2006. Cultivating Quantitative Literacy: The Role of Sociology. Teaching Sociology 34: 1-4.
Progressive Literacy • Entering (freshmen) • Work with numbers, introduce software, introduce question formation, introduce hypothesis testing • Midstream (sophomores and juniors) • Introduce advanced methods, increase expectations on quality of analysis, advance public presentation skills • Exiting (seniors) • Expected ownership of question formation, expansion of autonomy, movement from modules to projects
Distributions of Incomes in 2000, inserted manually into a table by students, pulling information from the CensusScope Site
Health Data in the Classroom Project • A collaborative initiative of the Health Promotion Research Committee and the Center for Faculty Excellence • Summer faculty stipends to develop modules using campus health data
Courses Using Health Data • Health Science • Computer Applications in Exercise Science • Biostatistics* • Tests & Measurements • Research Methods • Sociology • Introduction to Contemporary Mental Health • Introduction to Sociology • Women & Health • Seminar: Who are We & What Do We Think? • Economics • Econometrics • Math • Computer Information Technology • Math for Decision Making with Technology* • Speech Communication • Business & Professional Communication* • Psychology • Introduction to Psychology • Research Team *Fall 2007
Health Surveys • Core Institute Alcohol and Drug Survey • Southern Illinois University • Alcohol & drug use/abuse & consequences • National College Health Assessment • American College Health Association • General & Preventive Health • Academic Impacts • Violence • Alcohol, Tobacco & Drug Use • Sexual Behavior • Nutrition & exercise • Depression/Mental health
Multiple Levels of Engagement • Faculty presents data for discussion (Intro to Sociology) • Students use data for presentation or project (Research Methods – Health Science) • Full semester work resulting in student professional presentation (Psychology Research Team; Econometrics Final Paper)
Why Are Ithaca College Student GPAs Related to Substance Use? Percent Using Substances More Than 5 Days Past 30 Days Grades Source: National College Health Assessment 2003-2005. Data Limited to Ithaca College Students
Which Causal Diagram is More Likely to be True? Drug Use Academic Problems Or Drug Use Academic Problems Could you design a study to determine which sequence is correct?
Project #1 Point-Counterpoint Using data to support your point of view Format: Students will be assigned to one of 4 groups. The groups are as follows: Group 1: Alcohol, tobacco, and drug use is a problem at Ithaca College. Group 2: Alcohol, tobacco, and drug use is NOT a problem at Ithaca College. Group 3: Weight, Nutrition and Exercise is a problem at Ithaca College. Group 4: Weight, Nutrition and Exercise is NOT a problem at Ithaca College.
Groups will be comprised of 6-7 members. Each member will serve in at least one, but not more than 2 of the following “specialized” capacities. • Runner of the Analyses(1-2 students) • Speaker of the House (1-2 students) • Creator of all things Graphic (1-2 students) • Creator of all things Tabular (1-2 students) • Organizer of the Group (1 student)
Correlates of Aggressive Behavior in College Populations Ashleigh Crumb, Kristen Sabat, Kathryn Cooper, Timothy Blair, Kristen Cuomo, Brandon McLean, and Jessica Coppol, Ithaca College • Results • Using correlations, researchers found the following variables to be predictors of self reports of aggression: • Strong positive relationships were found between reports of acute alcohol consumption and aggression in females (r = .49**) and males (r = .59**). • There was a positive relationship between chronic alcohol consumption and aggression in females (r = .57**) and in males (r = .62**). • Moderate relationships between marijuana use and aggression were found for males (r = .30**) and females (r = .27**). • A positive relationship between cocaine consumption and aggression was found in males (r = .22**), but not in females (r = .09, n.s.). Discussion The present data is mostly consistent with the existing literature. As hypothesized, aggression was associated with a number of variables including alcohol consumption, gender, cocaine use, marijuana use, and exercise. Men reported higher levels of aggression than women, and the associations with the aforementioned variables were stronger for men. The lower correlations with women may be partly a function of the low incidence of self-reported aggression as a consequence of restricted range. Although chronic and acute alcohol consumption were both predictors of aggression for both men and women, chronic consumption had stronger associations than acute consumption with reports of aggressive acts. Being the target of aggression was more rarely predicted, and only for women, by chronic alcohol consumption (see Figure 2). Although previous research has suggested that high levels of vigorous exercise is predictive of lower levels of aggression, the present research indicated the opposite effect for males (see Figure 3). Perhaps different operationalizations in different studies were measuring different levels or constructs of aggression and exercise. Extreme exercise may reflect aggressive tendencies rather than “releasing them.” The hypothesis that men were more likely to be the aggressor and that the women were more likely to be the target of aggression was supported (see Figure 1). Consistent with previous literature, increased marijuana use was associated with greater levels of self-reported aggression. The relatively weak associations between cocaine and aggression may have been due to a reluctance to admit cocaine use. • Females reported significantly higher rates of being the target of aggression (M = 3.22) than did males (M = 3.11), t(622) = 2.93, p < .004. • It has been found that alcohol consumption is positively related to involvement in aggressive acts. “Correlational research has found alcohol to be present in about 50% of violent crimes” (Giancola, 2004). • Increased use of cocaine has been correlated with aggression; “…epidemiological and social science investigations have validated the increased probability of aggression with recent exposure to acute or chronic administration of cocaine” (Cunningham, 2004). • Kim (2004) found that diagnoses of depression in women increases the likelihood of being involved in aggressive behaviors. • Men are more likely to be the aggressor, whereas women are more likely to be the targets of aggressive acts; “…men had significantly higher levels of expressed violence across numerous relationship types (including overall non-partner violence severity)…” (Chermack, 2001). • It has been found that marijuana increases aggression. “Greater frequency of use of marijuana was found unexpectedly to be associated with great likelihood to commit weapons offenses” (Friedman, 2001). • No relationship between depression and aggression in males (r = -.29, n.s.) or females (r = .03, n.s.). • In terms of predicting the target of aggression, researchers found: • No relationship between acute alcohol consumption and being the target of aggression in females (r = .08, n.s.) or males (r = -.07, n.s). • A weak relationship between chronic alcohol consumption and being the target of aggression was found in females (r = .12*), but not males (r = -.06, n.s.). • No relationship between depression and being the target of aggression in females (r = -.03, n.s.) or males (r = -.29, n.s.) • The amount of vigorous exercise in the last seven days was associated with the likelihood of reporting having injured someone unintentionally while drunk in the previous year, t(240) = -2.22, p < .027. Interestingly, the effect was in the opposite direction of the hypothesized result. Males who reported having injured someone exercised more days (M = 4.60) than males who didn’t report injuring someone (M = 3.55). Introduction The purpose of this study was to identify correlates and patterns of non-sexual aggressive behavior and victimization in college students. Previous research hypothesized that alcohol consumption, gender, cocaine use, marijuana use, exercise, and depression would be related to aggressive behavior. • Aggression would decrease in participants who exercised more due to catharsis. “Nonexercisers had increased mean aggression and hostility scores than drop-out or advanced joggers” (Nouri, 1989). References Beer, J., & Nouri, S.; (1989). Relations of moderate physical exercise to scores on hostility, aggression, and trait-anxiety. Perceptual and Motor Scores, 68(3, Pt 2), 1191-1194. Chermack, S. T., Walton, M. A., Fuller, B. E., & Blow, F. C. (2001). Correlates of expressed and received violence across relationship types among men and women substance abusers. Psychology of Addictive Behaviors, 15, 140-151. Cunningham, K. A. (2004). Aggression upon adolescent cocaine exposure linked to serotonin anomalies: theoretical comment on Ricci et al. Behavioral Neuroscience, 118, 1143-1144. Friedman, A.S., Glassman, K., & Terras, A. (2001). Violent behavior as related to use of marijuana and other drugs. Journal of Addictive Diseases, 20(1), 49-72. Giancola, P. R. (2004). Executive Functioning and Alcohol-Related Aggression. Journal of Abnormal Psychology, 113, 541-555. Kim, H. K., & Capaldi, D. M. (2004). The association of antisocial behavior and depressive symptoms between partners and risk for aggression in romantic relationships. Journal of Family Psychology, 18, 82-96. Research Team 12 is an Ithaca College Psychology Department Research Team. Members of the team are Ashleigh Crumb, Kristen Sabat, Kathryn Cooper, Timothy Blair, Kristen Cuomo, Brandon McLean, Jessica Coppol, and Dr. Hugh Stephenson. • Gender differences were found in reports of aggression. • There was a significant difference between males and females in self-reported levels of aggression. Males reported significantly higher rates of aggression (M=5.06) than did females (M=4.88), t(622) = -2.433, p < .015. Method Data from the National College Health Assessment survey (NCHA) was analyzed. A sample of 633 students (285 male, 348 female) from a small college in upstate New York was considered in the analyses. Acute alcohol consumption was operationalized using item 13 from NCHA data asking, “The last time you partied/socialized, how many drinks did you have?” Cocaine, marijuana, and chronic alcohol use were operationalized by reports of how many days in the last 30 the substance was used. Aggression was also operationalized using combined scores of 3 different items relating to self reports of aggression. The target of aggression was operationalized using the combined score of 3 separate items related to being assaulted (non-sexually) and involvement in emotionally or physically abusive relationships. Exercise was operationalized by the number of days in the past week that one reported engaging in vigorous exercise. Legend * = p < .05; **= p < .01.
Table 7 Comparative logistic regression results In(binge/1binge)= β0 + β1X1i + β2X2i +…+ βkXki + εi n = 695** significant at the 1 percent critical level * significant at the 5 percent critical level
Health Data in the Classroom Goals • Disseminate health data collected at Ithaca College • Enhance activity-based education in the classroom • Increase student competence in basic data analysis • Provide accurate health data to the college community, and • Further the goals of the health promotion program.
Additional National Surveys • NSSE: Nat'l Survey of Student Engagement • George Kuh, Indiana University • CIRP Freshman Survey • Astin: Higher Education Research Institute • Cooperative Institutional Research Program
Additional Quant. Literacy Resources • Discipline-based projects, like IDA (Integrating Data Analysis) • National sources of modules, like SSDAN (Social Science Data Analysis Network)
Integrating Data Analysis Project • Jointly sponsored by American Sociological Association and National Science Foundation • To address the “scientific literacy” gap for undergraduate students in sociology through departmental initiatives aimed at creating enduring curricular change • Produced modules in non-research courses • Brief, active, data analysis activities related to course content
SSDAN Resources • Social Science Data Analysis Network (SSDAN) at the University of Michigan • Most popular resources • Census Scope • General Social Surveys • WebCHIP
Challenges • Preparing modules takes time • Institutional permission can be tricky • Faculty reluctant to teach “math” • Faculty reluctant to teach “health” • Faculty don’t know the content misinformation is conveyed
Rewards • Students love using “real” data • Faculty get energized about new exercises • Grants provide positive incentives • Institutional goal of quantitative literacy is supported • Institutional goal of health promotion is enhanced
For More Information • Priscilla Quirk, pquirk@ithaca.edu • Steve Sweet, ssweet@ithaca.edu • Susanne Morgan, morgan@ithaca.edu