Download
1 / 20
200 likes | 230 Views
This article provides a critical analysis of the current state of evaluations in medical visualization, focusing on the limitations and gaps in existing evaluation methods. It discusses the need for more meaningful tasks, such as diagnostic accuracy and surgical strategy, and suggests the use of insight-based evaluations and eye-tracking research to enhance evaluation approaches.

E N D
A Critical Analysis of Evaluations in Medical Visualization Bernhard Preim
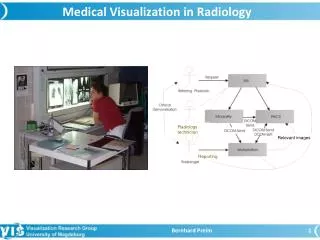
Introduction • Purpose of Medical Visualization Systems: • Diagnosis (detection and detailed assessment of diseases), e.g. rupture risk of cerebral aneurysms, tumor staging and grading • Therapy planning (decisions about intervention, radiation treatment, surgery; detailed assessment of access, stents, implants w.r.t. size, shape, material) • Collaborative sense-making (tumor board, stroke unit discussion) • Medical education (anatomy, surgery, knowledge gain and awareness for risks and complications) • Patient education (joined decision about treatment) • Medical research (identification of risk factors in epidemiology) Bernhard Preim
Current State of Med. Vis. Evaluation • How Med.Vis. systems are evaluated? • Often only anecdotical evidence • Reviewers: „evaluation section is only minimally informative“ • Individual medical visualization techniques are perceptually evaluated w.r.t. shape and depth perception, e.g. Ropinski, 2006; Joshi, 2008; Lawonn, 2015 • Evaluations are focussed on task completion times, error rates and preferences. • A survey article (Preim, 2016) and a guidelines paper (Saalfeld, 2017) summarize how to carry out and analyze such evaluations. Bernhard Preim
Evaluation of Depth Perception Comparison of normal and depth-enhanced visualization of vascular structures (From: Joshi, 2008) Comparison of normal and depth-enhanced shadow in ultrasound data (From: Solteszova, 2010) Bernhard Preim
Current State of Med. Vis. Evaluation • Evaluations are low level; not related to diagnostic and treatment decisions or other cognitive activities, such as learning. • What else there is? • Evaluations of the knowledge gain in anatomy teaching systems (pre- and posttests) • Careful discussion of spatial ability (low/medium/high) (Preim, 2018) • Few studies of the influence of 3D visualizations on the surgical strategy (can we operate the patient? How big is the resection volume? What is the access path?) (Fischer, 2009; Hansen, 2014; Lamade, 2000) • Few studies on diagnostic accuracy (e.g. virtual colonoscopy: Are polyps of a certain size detected?) • Limitations: Overall assessments do not reveal which features/vis. techniques contribute to the cognitive processes. • Cognitive analysis of interpretation of image stacks based on Think Aloud (van der Gijp, 2015) Bernhard Preim
Influence on Surgical Strategies • Users assessed operability first based on CT data and later based on interactive 3D visualizations (Fischer, 2009). In 2 from 7 cases, the surgical strategy changed (one patient could be operated more gently; and one originally considered inoperable could be operated). Bernhard Preim
MedVis: Influence on the Surgical Strategy • Influence of functional volume analysis and 3D visualization on surgical strategy, confidence and trust(From: Hansen, 2014) Bernhard Preim
Motivation • Look in other fields – Evaluation in HCI: • Primarily controlled lab experiments based on carefully chosen tasks, such as selection of 3D objects, placement of 3D objects, docking tasks, navigation to a target in a virtual environment • Compared to Med. Vis: more meaningful tasks, typically learning effort as additional parameter • Often added by think-aloud, logging protocols, screen capture and video analysis to understand differences • Also often limited to routine aspects to be studied in a lab, rarely with large amounts of expert users and restricted to rather basic tasks Bernhard Preim
Long term case studies • Motivation (Plaisant, 2004): • „laboratory studies became ever more distant from practical problems and broader goals“(Shneiderman, 2006) • Work and leisure activities are situated and context-dependent and thus cannot be fully studied in any lab experiment • developers need to make so many decisions that novel forms of testing are needed. • Exploratory activities, e.g. discovery in large scientific, business or finance data cannot be explored in a lab study with predefined tasks (non-routine aspects dominate) • → More field study and case study work is needed in (medical) visualization Bernhard Preim
Insight-Based Evaluations • Link to medical visualization: • Visual analytics of epidemiology data would highly benefit from an insight-based evaluation, ideally as a longitudinal activity, combined with logging and replay functions. • Phone interviews may replace site visits in case of remote partners Bernhard Preim
Eye-Tracking Based Research • Eye trackers • record time and position of eye fixation, including „jumps“ (saccadic movements) when users read images • Enable an analysis of scanpaths • Enable an analysis of areas of interest; regions that were fixated for a longer time. • Are frequently used in UI design (screen design, web design) • Are used in medical applications to study the patterns of younger and senior physicians viewing X-ray images Bernhard Preim
Eye-Tracking Based Research in Medicine • Selective research in medicine: • Viewing patterns in mammography for beginners and experienced radiologists (Krupinski, 1993; 1996) • Viewing pattern for the diagnosis of lung nodules (Krupinski, 2003) • Viewing patterns in CT head data with injuries (comparison of neurologist and laymans‘ search strageis (Matsu, 2011) • Extension to stacks of 2D images (CT, MRI) • Eye-tracking has to be adapted (Venja, 2015) • Extension to 3D visualizations of the neck anatomy along with (enlarged) lymph nodes (Burgert, 2007) Bernhard Preim
Eye-Tracking Based Research in Medicine • Aspects analyzed with eye tracking in radiology (van Der Gijp, 2017): • time on task, • eye movement characteristics of experts, • differences in visual attention, • visual search patterns, • search patterns in cross sectional stack imaging, and • teaching visual search strategies. Bernhard Preim
Eye-Tracking Based Research in Medicine • Top images: an image and the resulting Scanpaths attention landscape • Bottom images: the 3D rendering employed in the study(From: Burgert, 2007) Bernhard Preim
Eye-Tracking Based Research in Medicine • Scan-paths and AOI analysis. Data was analyzed individually, for novices and experts and also differences between them. Experts looked longer at few places where they expect metastasis (From: Burgert, 2007). • Since then: not a single eye-tracking based evaluation of med. vis. Bernhard Preim
Summary • Medical visualization, in particular education and training applications benefit from UX-inspired design and corresponding evaluation (engagement, fun, memorability) • Long-term evaluations with ethnographic methods are essential for diagnosis and treatment planning applications • Differences should not only be detected in an evaluation, but explored, e.g. with think-aloud or video analysis • Eye-tracking based research should be used to learn more about cognitive processes related to the use of medical visualization. • High level cognition needs to be analyzed (e.g. assessment of infiltration, … of operability, … of rupture risk…) • Much can be learnt from HCI, infovis and visual analytics experiences. Bernhard Preim
References • [Amar, 2005] Robert A. Amar, James Eagan, John T. Stasko: “Low-Level Components of Analytic Activity in Information Visualization”, Proc. of INFOVIS, 2005: 15 • [Andrews, 2008] K. Andrews. “Evaluation comes in many guises”, Prof. of BELIV Workshop 2008 • [Andrienko, 2012] Gennady L. Andrienko, Natalia V. Andrienko, Michael Burch, Daniel Weiskopf: Visual Analytics Methodology for Eye Movement Studies. IEEE Trans. Vis. Comput. Graph. 18(12): 2889-2898 (2012) • [Bateman, 2010] S. Bateman, R. L. Mandryk, C. Gutwin, A. Genest, D. McDine, and C. Brooks. Useful junk?: the effects of visual embellishment on comprehension and memorability of charts. Proc. of the ACM SIGCHI Conference on Human Factors in Computing Systems, pages 2573–2582, 2010 • [Bertini, 2007] Enrico Bertini, Catherine Plaisant, and Giuseppe Santucci. 2007. BELIV'06: beyond time and errors; novel evaluation methods for information visualization. interactions 14, 3 (2007), 59-60 • [Burch, 2011] M. Burch, N. Konevtsova, J. Heinrich, M. Höferlin, D. Weiskopf: Evaluation of Traditional, Orthogonal, and Radial Tree Diagrams by an Eye Tracking Study. IEEE Trans. Vis. Comput. Graph. 17(12): 2440-2448 (2011) • [Burgert, 2007] O Burgert, V Örn, BM Velichkovsky, M Gessat, M Joos, G Strauß, C. Tietjen, B. Preim, I. Hertel. „Evaluation of perception performance in neck dissection planning using eye tracking and attention landscapes“, Proc. of SPIE Medical Imaging 2007: Image Perception, Observer Performance, and Technology • [Crab, 2009] A. Crabtree, T. Rodden, P. Tolmie, and G. Button (2009). „Ethnography considered harmful“, Proc. of the ACM SIGCHI Conference on Human Factors in Computing Systems, pp. 879-888 • [Dour, 2006] Paul Dourish. 2006. Implications for design. In Proc. of ACM SIGCHI Conference, pp. 541-550. • [Ellis, 2006] G Ellis, A Dix (2006). “An explorative analysis of user evaluation studies in information visualization”, Proc. of the AVI workshop on BEyond time and errors • [Fischer, 2009] M Fischer, G Straus, S Gahr, I Richter, S Müller, O Burgert et al. „Three-dimensional visualization for preoperative planning and evaluation in head and neck surgery“, Laryngo-rhino-otologie 88 (4): 229-233 • [Hansen, 2014] C. Hansen, S. Zidowitz, B. Preim et al. „Impact of model-based risk analysis for liver surgery planning. Int. J. Computer Assisted Radiology and Surgery 9(3): 473-480 (2014) Bernhard Preim
References (II) • [Joshi, 2008] A. Joshi, X. Qian, D. P. Dione, K. R. Bulsara, C. K. Breuer, A. J. Sinusas, X. Papademetris. „Effective visualization of complex vascular structures using a non-parametric vessel detection method“, IEEE Trans. Vis. Comput. Graph., vol 14(6), 2008. • [Kobsa, 2004] Alfred Kobsa: User Experiments with Tree Visualization Systems. INFOVIS 2004: 9-16 • [Kurz, 2016] Kuno Kurzhals, Brian D. Fisher, Michael Burch, Daniel Weiskopf: Eye tracking evaluation of visual analytics. Information Visualization 15(4): 340-358 (2016) • [Krupinski, 1993] Krupinski, E.A, Nodine, C.F. and Kundel, H.L. (1993). Perceptual enhancement of tumour targets in chest X-ray images. Perception and Psychophysics, 53, 519-526. • [Krupinski, 1996] Krupinski, E. A. (1996). Visual scanning patterns of radiologists searching mammograms. Academic Radiology, 3(2), 137–144. • [Krupinski, 2003] Krupinski, E.A., Berger, W.G., Dallas, W.J. and Rohrig, H. (2003). „Searching for nodules: What features attract attention and influence detection?“, Academic Radiology, 10, 861-868 • [Lamade, 2000] W. Lamadé; G. Glombitza, L. Fischer (2000).The Impact of 3-Dimensional Reconstructions on Operation Planning in Liver Surgery, Archives of Surgery; 135(11):1256-1261 • [Lee, 2006] Bongshin Lee, Catherine Plaisant, Cynthia Sims Parr, Jean-Daniel Fekete, Nathalie Henry: Task taxonomy for graph visualization. Proc. of BELIV 2006: 1-5 • [Matsu, 2011] Matsumoto H, Terao Y, Yugeta A, Fukuda H, Emoto M, et al. (2011). „Where Do Neurologists Look When Viewing Brain CT Images? An Eye-Tracking Study Involving Stroke Cases“, PLoS ONE 6(12): e28928 • [Netzel, 2017] R. Netzel, B. Ohlhausen, K. Kurzhals, R. Woods, M. Burch, D. Weiskopf: User performance and reading strategies for metro maps: An eye tracking study. Spatial Cognition & Computation 17(1-2): 39-64 • [Nodine, 1987] Nodine, C.F. and Kundel, H.L. (1987).Using eye movements to study visual search and to improve tumor detection. RadioGraphics 7(6) 1241-1250. • [Perer, 2008] Adam Perer, Ben Shneiderman: Integrating statistics and visualization: case studies of gaining clarity during exploratory data analysis. Proc. of CHI 2008: 265-274 Bernhard Preim
References (III) • [Plaisant, 2004] C Plaisant. “The challenge of information visualization evaluation”, Proc. of Advanced visual interfaces, 109-116 • [Preim, 2016] B.Preim, A. Baer, D. W. Cunningham, T. Isenberg, T. Ropinski: „A Survey of Perceptually Motivated 3D Visualization of Medical Image Data“, Comput. Graph. Forum 35(3): 501-525 (2016) • [Preim, 2018] B. Preim and P. Saalfeld “A Survey of Virtual Human Anatomy Education Systems”, Computers & Graphics, accepted with minor revision. • [Ropinski, 2006] Timo Ropinski, Frank Steinicke, Klaus H. Hinrichs: Visually Supporting Depth Perception in Angiography Imaging. Smart Graphics 2006: 93-104 • [Saalfeld, 2016] S Glaser, P Saalfeld, P Berg, N Merten, B Preim. “How to Evaluate Medical Visualizations on the Example of 3D Aneurysm Surfaces”, Proc. of EG Workshop on Visual Computing in Biology and Medicine • [Saket, 2016] Bahador Saket, Alex Endert, John T. Stasko: “Beyond Usability and Performance: A Review of User Experience-focused Evaluations in Visualization”, Proc. of BELIV, 2016: 133-142 • [Saraiya, 2004] Purvi Saraiya, Chris North, Karen Duca. “An evaluation of microarray visualization tools for biological insight“, Proc. of INFOVis, 2004, pp. 1-8 • [Saraiya, 2006] Purvi Saraiya, Chris North, Vy Lam, Karen Duca: An Insight-Based Longitudinal Study of Visual Analytics. IEEE Trans. Vis. Comput. Graph. 12(6): 1511-1522 (2006) • [Seo, 2006] Jinwook Seo, Ben Shneiderman: Knowledge Discovery in High-Dimensional Data: Case Studies and a User Survey for the Rank-by-Feature Framework. IEEE Trans. Vis. Comput. Graph. 12(3): 311-322 (2006) • [Shneiderman, 1996] Ben Shneiderman: “The Eyes Have It: A Task by Data Type Taxonomy for Information Visualizations”. Proc. of Visual Languages 1996: 336-343 • [Shneiderman, 2006] Ben Shneiderman, Catherine Plaisant: Strategies for evaluating information visualization tools: multi-dimensional in-depth long-term case studies. Proc.of BELIV, 2006: 1-7 • [Turkay, 2013] Cagatay Turkay, Arvid Lundervold, Astri Johansen Lundervold, Helwig Hauser: “Hypothesis Generation by Interactive Visual Exploration of Heterogeneous Medical Data”. Proc. of CHI-KDD 2013: 1-12 Bernhard Preim
References (IV) • [vanDer, 2015] van der Gijp, A., et al. (2015). Volumetric and two-dimensional image interpretation show different cognitive processes in learners. Academic Radiology, 22(5), 632–639. • [vanDer, 2015] van der Gijp, A., Ravesloot, C. J., Jarodzka, H. et al. "How visual search relates to visual diagnostic performance: a narrative systematic review of eye-tracking research in radiology",Advances in Health Sciences Education, 2017, 22(3): 765--787 • [Venja, 2015] Antje C Venjakob, Claudia R Mello-Thoms (2015). “Review of prospects and challenges of eye tracking in volumetric imaging”, Journal of Medical Imaging 2016, 3 (1) • [Whit, 1996] Steve Whittaker and Candace Sidner (1996). Email overload: exploring personal information mana-gement of email. Proc. of the ACM SIGCHI Conference on Human Factors in Computing Systems, pp. 276-283 Bernhard Preim