Download
1 / 36
360 likes | 559 Views
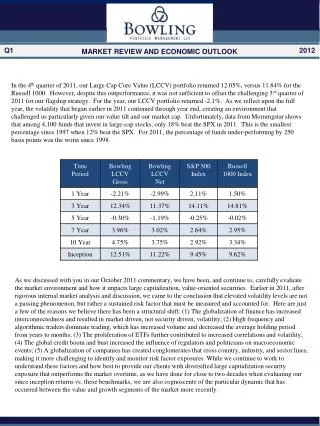
A Review of Recent IBD Market Outlook Performance . Looking at the Performance of IBD’s Market Pulse Current Outlook . At last meeting, Vas noted a discussion about the IBD Outlook started in the SIPSIG group by member Kevin Campbell

E N D
Looking at the Performance of IBD’s Market Pulse Current Outlook • At last meeting, Vas noted a discussion about the IBD Outlook started in the SIPSIG group by member Kevin Campbell • Looking at IBD’s Outlook over the past six months, Kevin noted that it didn’t perform particularly well as a market timing tool. • His comment: “Result: Invested for 113 days over the 6 month period for a loss of 1.3%. Not a very good testament for the IBD timing approach.” • And so he asked for follow-up comments • I decided to expand on his analysis by accumulating the data back to 5/1/2008 • I’ve added a file in the Meetup with these results
The Data • IBD Outlook has used differing wording over time so I have interpreted all IBD signals as one of: "Market in Correction," "Uptrend Under Pressure," or "Confirmed Uptrend." • Since the Current Outlook is published the prior evening, I am continuing Kevin’s convention of showing the Current Outlook as applicable for the next day. • E.g., the IBD posted the Big Picture based on Thursday 1/26 results that same evening. The Outlook signal is then available for trading at the open of Friday 1/27.
Using the Signals • Kevin used the signals to purchase the SPY, and investing in the SH (inverse SP500) for short signals. • For simplicity (for my software), I used only the SPY. • Buy and Sell Rules: • Buy the SPY on the open of a "Confirmed Uptrend," Sell when signal downgrades to "Uptrend Under Pressure" or "Market in Correction.“ • Short the SPY on the open of "Market in Correction" and Cover when signals improve to either "Uptrend Under Pressure" or "Market in Correction."
The Results • For the period of 5/1/2008 to 12/31/2011, there were 59 signals (37 long trades and 22 short trades). • For 2011, signals worked only 33% of the time with a return of -3.75%.
Some Explanatory Notes About the Following Charts • The posted PowerPoint slides include bitmap pictures that can be expanded for a closer look. • IBD signals are shown on the charts color-coded with lavender shaded areas representing “Market in Correction,” and the pink areas as “Uptrend Under Pressure.” • Buy and Sell signals are shown respectively by solid green and red arrows, with Short and Cover signals as hollow green and red arrows. • System equity curves are shown as blue or green, while the red is system drawdown (not on same scale).
Looking at the Charts, When Does the IBD Outlook Work Well?(long-only chart)
And When Did Losses Occur ?(Focusing on 2010 and 2011, Long-Only)
Entries Generally Good, But Not Perfect Weak Entries, in Retrospect Some well-timed entries
Note the Importance of Following Market Correction Signals!Protect Your Profits
Some Observations • The Outlook appears to work best in trending markets; for shorts, when the Outlook goes to Market in Correction. • Performance slips in choppy and sideways markets. • In a few instances during 2011, reentry to the market has been late, missing parts of strong moves. • Note that one of IBD’s strongest strengths are the Market in Correction signals. PAY ATTENTION TO THESE SIGNALS. • A delay of even a day or two for several instances would have resulted in greatly increased losses. • So, are there ways to help us improve the perceived weaknesses?
So, we’re looking for Improvements in Market Timing Tools • First, market timing may be a misnomer. The term “Market Timing” seems to imply some forecasting ability and that appears very difficult to do accurately. • The market often changes mode such as from trending to trading range, low volatility to high volatility, bull to bear etc. • Our goal is to better adapt to the changing conditions since it appears that these new regimes persist for some time. • Therefore, staying in sync with the market can help protect your capital.
Let’s Look at Two Other Systems to Compare to the IBD Outlook Signals • A triple moving average system and, a stochastic oscillator system. • Neither is particularly good (IMO), but they behave differently in different market modes. • That is, don’t trade these without a much closer look. • But note the differences and similarities to IBD signals
A Sample Moving Average System • This sample system is one of nine market timing systems noted at http://dkreport.blogspot.com/2007/07/timing-indicators.html . • The MAs tend to be faster than many trend systems. • Among MA systems, you can find hundreds of variations, using many types and lengths of MAs – but all have some similarities. • A quick look at the results of this example system • Buy when EMA(5) > EMA(20) and EMA(10) > EMA(20) • Sell when EMA(5) < EMA(20) and EMA(10) < EMA(20) • The system earned a small profit from 5/1/2008 to 12/31/2011, but had only 39% winners. This system is not really tradable by itself. • MA systems, in general, work well for trend-following. But, since markets trend only a fraction of the time - this limits their effectiveness
5-10-20 MA System Results Similar Strengths to IBD And weaknesses
Many Entries and Exits Worse then IBD Even with the “Fast” Moving Averages Late Better
Just Some Context • The Au.Tra.Sy blog – Automated Trading System located at http://www.automated-trading-system.com/trend-following-wizards-december/ prepares a composite index for major trend following funds. • For 2011 – these trend following firms lost -7.5% , on average, for the year.
Oscillator Systems Generally Work Better in Trading Range Markets • Many examples of oscillators, such as stochastics, RSI, ROC, etc. • An example stochastic system (also, not tradable) • Buy when oversold (30 level), and fast stochastic (K) crosses slow Stochastic (D) • Sell when stochastics cross again • Short when overbought (80 level) and slow stochastic (D) crosses fast Stochastic (K) • Cover when stochastics cross again • Lost money in period of 5/1/2008 to 12/31/2011 even with a 55% winning percentage. • Largest losses when oversold/overbought conditions persist • That is, when markets go into a strong trend
Oscillator Systems work Poorly in Trends, but Do Well at Turns Whipsaw Catches Turns Arrows show stochastic crosses
Knowing When to Use an Oscillator May Help the More Aggressive to Look for Potential Price Pattern Entries Also, watch weakness in oscillator peaks Note oscillator signal in conjunction with Wyckoff spring
How Well Does the IBD Market Outlook Compare to some other Market Timing Tools? • Hundreds of examples, but I’m not aware of a “Holy Grail.” We’re just trying to find a small edge. • The market mode directly affects system performance. • E.g. Comparing a trending vs. oscillator system • Market breadth can also be a useful addition to market analysis. • One example: The McClellan Oscillator • Volatility trends can provide context in interpreting these other tools.
Some Useful Quotes About Market Timing Systems • The following quoted from: http://dkreport.blogspot.com/2007/07/timing-indicators.html • “1. There is no such thing as a perfect timing indicator. Period. 2. All timing systems have statistically significant margins for error. 3. To improve their efficacy, timing systems should be used in combination with other metrics. 4. Even the best timing indicators give false signals. 5. One of the biggest problems is lag: the signal may be correct, but it happens either early or late.”
Market Breadth Indicators Add a Composite Perspective • Breadth indicators are a composite indicator of index components • Provides another view of market extremes (overbought and oversold) • http://stockcharts.com/freecharts/marketsummary.html • An example is the McClellan Oscillator ($NYMO at Stockcharts.com and T2106 for Worden products) • Several versions and calculations- set your own benchmark for an extreme • NOT particularly useful when not at an extreme • Like other signals, has to be read in context
The McClellan Oscillator Highlights Extreme Overbought and Oversold Conditions Less clear what to do, but breadth provides a note of caution A simple trendline helps understand these breadth signals Hinting at a turn?
What’s Happening Now? Be cautious, but watch for trendline break
Another Tool: Volatility Trend and Extremes Can be a Warning • Don’t look just at VIX levels – but the current level compared to the MA • A strong danger signal is when the VIX goes 20% above its 100 day moving average, and, continues to increase. A cross of the 10MA over the 100MA is a signal to look closer. (Gives some false signals) • However, the VIX may stay elevated for some time – so the trend is the most important forward looking signal, not the level • ATR(3) bands are similar, but sometimes a few days slow. More useful for individual stocks • VERY useful in interpreting overbought and oversold conditions • If volatility is trending up – expect weakness in prices • If volatility is trending down – expect some continued strength
Watch for VIX Trendline Breaks, but Also Note a Cross of the 10MA and 100MA as a First Warning
While the Market Experienced a Number of Corrections During this Period, Note that Some of the Intermediate Vix Trends Were Still Bullish Also, note that recently the VIX has been very bullish
Note How Overbought Conditions React Differently When Volatility is in a Downtrend Compared to an Uptrend
Active Trader Magazine (March 2012 issue) Shows How the VIX Occasionally Gives Clear Buy and Sell Signals 7/22/2011, IBD went to Uptrend Under Pressure on 7/26 and Correction on 7/28 Price Diverging from VIX – a Sell Signal. Note MA crossover as well IBD back to Uptrend on 10/13 Price diverging from VIX – a Buy Signal (10/3/11)
However, VIX Is Often Inconsistent as an Indicator by Itself • Needs to reviewed in context with other indicators. • Intermediate signals seem to work better than short-term signals. • The trend is perhaps more important than the level. High levels can persist for quite some time. • A spike, then a continued increase, is a time to step aside. • ALWAYS pay attention to spikes in the VIX. They sometimes provide a little extra warning of real trouble. Its better to look at a few false signals than to miss the big one.
An Unusual System with Promise. A VIX Timing System with a High Volatility Filter • Adapted from http://dkreport.blogspot.com/2007/07/timing-indicators.html • Buy the S&P 500 when: • (a) the 11-Day SP500 EMA is below the 11-Day SP500 SMA AND • (b) the 11-Day VIX EMA is above the 11-Day VIX SMA. • Exit the position when either of the two conditions above are NOT met. • Add a longer-term filter NOT to buy when current VIX is 20% above its 100 day MA (Slightly different than 10MA/100MA on chart) • Mildly profitable with 65% winners and okay system statistics • I have uploaded an Excel worksheet with calculations and backtest results • System seems to perform weakly in sharp downdrafts, but well as upturns start • Do not trade this without your own careful review
Performs Reasonably in Many Markets, But Reacts Poorly to Volatility Spikes
A Free Timing Resource – Wishing Wealth Blog • A highly recommended resource is the Wishing Wealth blog produced by Dr. Eric Wish. • I would characterize this as a trend following system, reviewing a number of factors and breadth signals to assess the stage of the market. • Don’t have historical test data, but appears to be a more slower reacting trend system than what we’ve looked at • Can be found at http://wishingwealthblog.com/ • RSS feed available from “About” tab and he also produces a daily e-mail.
Another Free Resource is a Trend System from Les Masonson • Author of Buy – Don’t Hold • Sign up for RSS feed at http://www.buydonthold.com/ for signals • The book’s original system has been revised down to four indicators (now called version 2) • Indicator #2 NASDAQ Composite Index with 100-dma Crossover • Indicator #5 NASDAQ Composite Index with MACD Crossover • Indicator #6 AAII Weekly Investor Sentiment Survey Bullish Percentage • Indicator #8 NASD Summation Index 5-Day EMA Crossover with MACD Confirmation • -6.2% return for 2011. More intermediate term signals so somewhat more vulnerable to drawdown
Conclusion • Systems need to adapt to market conditions. • All systems fail at some time. • So, you need to look at multiple systems and indicators to develop your own consensus opinion. • IBD Market Outlook provides some excellent signals for corrections, but weaker in trading range market • I would recommend the 5-10-20 MA system as a trend reference vs IBD. • Also, be sure to follow your favorite oscillator and watch it carefully in corrections or under pressure markets. (Know when to use it) • Add breadth and volatility measures to your analysis. • Try to look at any tools in the context of the mode of the market. • These tools will help add a market frame of reference to your price action analysis. • I would be very interested in hearing about any market timing systems you think are worthwhile