Working With Normal Models
Working With Normal Models. Driving. It takes you 20 minutes, on average, to drive to school with a standard deviation of 2 minutes Suppose a Normal Model is appropriate for the distribution of driving times. A) How often will you arrive at school in less than 22 minutes? Answer:


Working With Normal Models
E N D
Presentation Transcript
Driving • It takes you 20 minutes, on average, to drive to school with a standard deviation of 2 minutes • Suppose a Normal Model is appropriate for the distribution of driving times • A) How often will you arrive at school in less than 22 minutes? • Answer: 68% of the time we’ll be within 1 SD, or two minutes, of the average 20 minutes. So 32% of the time we’ll arrive in less than 18 minutes or in more than 22 minutes. Half of those times (16%) will be greater than 22 minutes, so 84% will be less than 22 minutes
Driving • It takes you 20 minutes, on average, to drive to school with a standard deviation of 2 minutes • Suppose a Normal Model is appropriate for the distribution of driving times • B) How often will it take you more than 24 minutes? • Answer: 24 minutes is 2 SD above the mean. By the 95% rule, we know 2.5% of the times will be more than 24 minutes
Driving • It takes you 20 minutes, on average, to drive to school with a standard deviation of 2 minutes • Suppose a Normal Model is appropriate for the distribution of driving times • C) Do you think the distribution of your driving times is unimodal and symmetric? • Answer: “Good” traffic will speed up your time by a bit but traffic incidents may occasionally increase the time it takes so times may be skewed to the right and there may be outliers.
Driving • It takes you 20 minutes, on average, to drive to school with a standard deviation of 2 minutes • Suppose a Normal Model is appropriate for the distribution of driving times • D) What does the shape of the distribution then say about the accuracy of your predictions? • Answer: If this is the case the Normal Model is not appropriate and the percentages we predict would not be accurate.
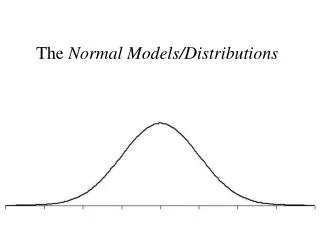
SAT Scores Example • Each 800 point section of the SAT exam is constructed to have a mean of 500 and a Standard Deviation of 100 • The distribution of scores is unimodal and symmetric • Suppose you earned a 600 on one part of the SAT, where do you fall among all students who took the test?
SAT Scores Example • Does the z-Score tell you anything? • We need to employ our Normal Model!
SAT Scores Example • 68% of students had scores that fell no more than 1 SD from the mean. • 100% - 68% = 32% had scores more than 1 standard deviation from the mean • Only half of those were on the high side, so 16% of students were better than my score of 600. • My score is higher than about 84% of students taking the exam.
Finding Normal Percentiles i.e. what if your score was 680?
We Have Two Options: • If the value doesn’t fall at exactly 1, 2, or 3 SDs from the mean, we have two options: • Technology • Tables Either way, start by standardizing into z-scores
Table • To Find In Table: • Look down left column for the first two digits, 1.8 • Then across the row for the third digit, 0 The table gives .9641, this means 96.41% of the z-scores are less than 1.80. Only 3.6% of people, then, scored better than 680 on the SATs
Calculator! • Look under 2nd DISTR • There are three “norm” functions:normalpdf(normalcdf(invNorm( • normalpdf(calculatesy-values for graphing a Normal Curve • We won’t use this one much but lets try it now, Y1=normalpdf(X) in a graphing WINDOW with Xmin=-4, Xmax=4, Ymin=-0.1, and Ymax=0.5
Calculator! • Normalcdf( finds the proportion of area under the curve between two z-score cut points, by specifying normalcdf(zLeft, zRight) • You will use this function often!
Calculator! Example • Example 1 • Let’s find the shaded area: • Under 2nd DISTR: • Select normalcdf( • Hit ENTER • Specify the cut points Normalcdf(-.5,1) and hit ENTER You get 0.533, and that is the area between those two points, 53.3% Approximately 53% of a Normal Model falls between half a standard deviation and below 1 standard deviation above the mean
Example 2 • Previous SAT example: • We determined the fraction of scores above your score of 680
SAT Example • First we need to find z-scores for the cut points: • 680 is 1 SD above the mean, your z-score is 1.8This is the left cut-point • The standard Normal extend rightward forever, but remember how little of the data lies beyond +/- 3 SD • Take the upper cut point of say, 99. Use +/-99 as your general rule of thumb • Use the command: Normalcdf(1.8,99) Answer: .0359302655 So 3.6% of SAT scores are higher than 680.
Typical Question • What z-score cuts off the top 10% in a Normal Model? • Before – find areas (percentages of total) from the z-score • Now – Find z-score from percentages
By Table • From the table, we need an area of .900 • This exact area is not there, but .8997 is pretty close • This shows up in table with 1.2 in left margin and .08 in top margin • Z-score for 90th percentile is 1.28
By Calculator • The function we will use is under 2nd DISTR -> invNorm( • For the top 10%, we take invNorm(.90) and get: • 1.281551567 • Only 10% of the area in a Normal Model is more than about 1.28 SDs above the mean
Pesky Word Problems! • (pg121) • A cereal manufacturer has a machine that fills cereal boxes • Boxes are labeled 16oz • The machine is never going to be perfect so there will be minor variations • If the machine is set to 16oz and the Normal model applies, about half the boxes will be underweight, leading to angry customers
Pesky Cereal Problem! • THINK Question: What portion of cereal boxes will be under 16 oz? Variable: Let y = weight of each cereal box Use a N(16.3,0.2) model
Pesky Word Problems! • To avoid possible lawsuits from angry customers, the company sets the mean to be a little higher than 16oz • The company believes the packaging machine fills in an amount of cereal that fits a Normal model with a SD = .2oz • The company decides to put an average of 16.3oz of cereal in each box • Question 1: What fraction of cereal boxes will be underweight?
Cereal!!! • Convert cut-off value into a z-score: • Find the area with your calculator: • Area(y<16)=Area(z<-1.5)=.0668
Cereal… • Question 1: What percent of cereal boxes will be underweight? • Answer 1: Approximately 6.7% of the boxes will contain less than 16oz
Cereal Question 2 • The company’s lawyers say that 6.7% is too high. They insist that no more than 4% of cereal boxes be underweight. • What new mean setting does the company need to insure this happens? • Let y=weight of cereal box • I don’t know the mean amount of cereal. The standard deviation is still 0.2 oz, so the model is
Cereal Q2 • Solution: • Find a z-score that cuts off the lowest 4% • Use this information to find . • The z-score with .04 area to the left is z= -1.75 • What function finds this?
Cereal Q2 • For 16 to be -1.75 SD below the mean, the mean must be: • 16+1.75(.02)=16.35oz • The company must set the machine to average 16.35oz of cereal per box to have less than 4% be underweight
Cereal……….Question 3! • The President of the cereal company isn’t happy. He thinks they should give away less free cereal, not more. • His goal is to set the machine no higher than 16.2oz and still have only 4% underweight boxes • The only way to accomplish this is to reduce the standard deviation. What SD must the company achieve and what does this mean about the machine?
Cereal 3 • Question: What SD will allow the mean to be 16.2oz and still have only 4% of boxes underweight? • Let y = weight cereal in box • I know the mean, but not the SD, so use
Cereal 3 • I know the z-score with 4% below it is -1.75 from previous problem • Sole for
Cereal 3 • The company must get the machine to box cereal with a standard deviation of only 0.114 ounces. This means the machine must be more consistent (by nearly a factor of 2) at filling the boxes.
Homework Pg 130, # 17, 19, 21, 37, 41