Analyzing Relationships Between Categorical Variables
Learn how to distinguish between explanatory and response variables for categorical data, make segmented bar charts, and determine associations between categorical variables. Understand how to identify explanatory variables with practical examples and create segmented bar charts effectively.

Analyzing Relationships Between Categorical Variables
E N D
Presentation Transcript
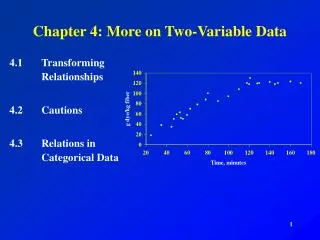
Analyzing Two-Variable Data Lesson 2.1 Relationships Between Two Categorical Variables 2
Relationships Between Two Categorical Variables • Distinguish between explanatory and response variables for categorical data. • Make a segmented bar chart to display the relationship between two categorical variables. • Determine if there is an association between two categorical variables and describe the association if it exists.
Relationships Between Two Categorical Variables The first step in describing relationships between two categorical variables is to determine which variable is the response variable and which variable is the explanatory variable. Response Variable, Explanatory Variable A response variable measures an outcome of a study. An explanatory variable may help predict or explain changes in a response variable. Note: In some relationships, there isn’t a clear explanatory or response variable.
Too late for politics? Identifying explanatory variables PROBLEM:Identify the explanatory variable for the following relationships. Explain your reasoning. (a) Class in school (freshman, sophomore, junior, or senior) and whether or not a student is allowed to stay up past 11:00 p.m. on a school night. The explanatory variable is the class in school, because the class in school might help explain whether or not a student is allowed to stay up past 11:00 p.m. on a school night. (b) Political viewpoint (conservative, liberal, or moderate) and gender for adults over 25 years old in the United States. The explanatory variable is gender, because gender might help predict the political viewpoint of adults.
Relationships Between Two Categorical Variables After identifying the explanatory variable, the next step is to display the distribution of the response variable for each category of the explanatory variable. This can be done with side-by-side bar charts or with segmented bar charts. Segmented Bar Chart A segmented bar chart displays the possible values of a categorical variable as segments of a rectangle, with the area of each segment proportional to the percent of individuals in the corresponding category.
Relationships Between Two Categorical Variables The figure below shows the side-by-side bar chart and corresponding segmented bar chart that display the relationship between gender and preferred superpower. Segmented bar charts are sometimes called “stacked” bar charts because they are the result of stacking the bars from a side-by-side bar chart.
Relationships Between Two Categorical Variables How to Make a Segmented Bar Chart 1. Identify the variables. Determine which variable is the explanatory variable and which is the response variable. 2. Draw and label the axes. Put the name of the explanatory variable under the horizontal axis. To the left of the vertical axis, indicate if the graph shows the percent (or proportion) of individuals in each category of the response variable. 3. “Scale” the axes. Write the names of the categories of the explanatory variable under the horizontal axis. On the vertical axis, start at 0% (or 0) and place tick marks at equal intervals until you reach 100% (or 1). 4. Draw “100%” bars above each of the category names for the explanatory variable on the horizontal axis. Make the bars equal in width and leave gaps between them. 5. “Segment” each of the bars. For each category of the explanatory variable, calculate the relative frequency for each category of the response variable. Then, divide the corresponding bar so that the area of each segment corresponds to the proportion of individuals in each category of the response variable. 6. Include a key that identifies the different categories of the response variable.
Which gender is more likely to have allergies? Making Segmented Bar Graphs Data on gender and whether or not a person had allergies were obtained from a random sample of 227 students who responded to a survey on the Census at School website. PROBLEM:Make a segmented bar graph to display the relationship between allergy status and gender for students in this sample. • Female Yes: • Female No: • Male Yes: • Male No:
Relationships Between Two Categorical Variables Once we make a graph, the final step is to determine if there is an association between the two categorical variables. Association There is an association between two variables if knowing the value of one variable helps us predict the value of the other. If knowing the value of one variable does not help us predict the value of the other, then there is no association between the variables.
Relationships Between Two Categorical Variables There appears to be an association between gender and superpower preference because knowing a person’s gender helps us to predict which superpower he or she would prefer. We can “see” the association in the segmented bar chart because the segments for each superpower aren’t the same size for the female graph and the male graph.
Is there an association between allergies and gender?Checking for association PROBLEM: Data on gender and whether or not a person had allergies were obtained from a random sample of 227 students who responded to a survey on the Census at School website. Use the graph to determine if there is an association between gender and whether or not a person has allergies. Explain your reasoning, then describe the association. There is a weak association between gender and having allergies because the percent of males with allergies differs little from the percent of females with allergies. Knowing the gender of a person helps only slightly in trying to predict whether or not (s)he has allergies. Females in this sample are only a little bit more likely to have allergies than males.
LESSON APP 2.1 Which finger is longer? Is there a relationship between gender and relative finger length? To investigate, a random sample of 452 U.S. high school students was selected.The two-way table shows the gender of each student and which finger was longer on his or her left hand (index finger or ring finger). • Make a segmented bar chart to show the relationship between gender and relative finger length. • Based on the graph, is there an association between gender and relative finger length? Explain your reasoning. If there is an association, briefly describe it.
LESSON APP 2.1 Which finger is longer? • Make a segmented bar chart to show the relationship between gender and relative finger length.
LESSON APP 2.1 Which finger is longer? • Based on the graph, is there an association between gender and relative finger length? Explain your reasoning. If there is an association, briefly describe it.
Relationships Between Two Categorical Variables • Distinguish between explanatory and response variables for categorical data. • Make a segmented bar chart to display the relationship between two categorical variables. • Determine if there is an association between two categorical variables and describe the association if it exists.