Download

1 / 19
190 likes | 212 Views
This briefing provides an overview of the history of population census in China, focusing on the methods and results of the 2010 Census Data Evaluation. It highlights the objectives, methods, and organization of the evaluation process, along with key conclusions regarding population accuracy, undercount rates, adjustments, and demographic trends. Challenges in using Post-Enumeration Survey (PES) data for evaluation are discussed, emphasizing the need for careful assessment of data quality. The briefing also covers the organization of the evaluation research, participant units, and comparison with administrative records to ensure accuracy. Overall, it offers a comprehensive analysis of the evaluation process and its implications for census data reliability in China.

E N D
Briefing on Census Data Evaluation in China Xiao Ning Guo Hui Hanoi, Viet Nam 2-6 December 2013
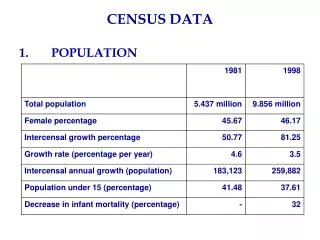
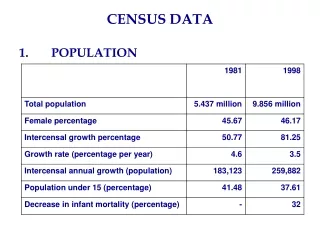
History of Population Census in China First Census: 1953 Population: 594.53 million Second Census: 1964 Population: 694.58 million Third Census: 1982 Population: 1008.18 million Fourth Census: 1990 Population: 1133.68 million Fifth Census: 2000 Population: 1265.83 million Sixth Census: 2010 Population: 1339.72 million
2010 Census: questionnaire Combination of long form (10%) and short form (90%) Short form:6 household items, 12 individual items Long form: 19 household items, 28 individual items
2010 Census: Schedule Preparation (Oct. 2007-Oct. 2010) Field enumeration (1-10 Nov. 2010) Field check (11-20 Nov. 2010) Post enumeration survey (Nov.-Dec. 2010) Data processing (Dec. 2010-Dec. 2011) Data dissemination and utilization (Apr. 2011 --- 2013)
Objectives of Data Evaluation To measure the accuracy of census data To get the net undercount rate To adjust census results (such as to estimate total population)
Methods Post-Enumeration Survey Demographic methods Compare with related administrative records
Two levels organization National level: Responsible for the survey in one selected enumerator of each province Provincial level: Responsible for the survey in the rest of selected enumerators of the province Post-Enumeration Survey (1)
Post-Enumeration Survey (2) Reference time: zero hour on November 26, 2010 about one month after census Respondents: people who lived in the enumerators at the reference time Samples:a total of 120 thousand people were selected from 402enumerators in 398 counties, the sampling fraction for the nation was 0.1 per thousand
Post-Enumeration Survey (3) 3 household items: number of persons births deaths 6 individual items: name gender date of birth place of residence at census reference time place of household registration duration since leaving place of household
Research on census data evaluation (1) National Bureau of Statistics of China (NBS) organized such research: Analysis and evaluate census data Write research papers Hold seminars on data evaluation
Research on census data evaluation (2) Participant units: Provincial bureaus of statistics Government departments Universities Research institutions
Compare with related administrative records Household registration from the Ministry of Public Security Education statistics from the Ministry of Education Birth data from The Family Planning Commission Mortality data from the Ministry of Civil Affairs
Some Evaluation Conclusions (1) 1. undercount of the population aged 0-9 is serious; there are undercount as well as overcount for those aged 20-45, with the number of overcount bigger than that of undercount; other age groups is highly accurate.
Some Evaluation Conclusions (2) 2. From PES, the net undercount rate of total population is 1.2 per thousand, and mainly found in low ages and infants. 3. Data of the total population at 1339.72 million is reliable .
Some Evaluation Conclusions (3) 4. Data of sex ratio is reliable. High sex ratio of births indicates omission of baby girls. However, importance should be attached to the fact of high sex ratio.
Some Evaluation Conclusions (4) 5. Fertility rate stays low. TFR1.18 in the Long Form is underestimated by at least 20% than the actual TFR 1.5 in 2010; there is a 15% omission of births occurred in the 12 months before the census.
Some Evaluation Conclusions (5) 6. Crude death rate stays low at 5.92‰, with an omission rate of over 20% vs. the actual death rate of 7.1‰; the average life expectancy is 74.83 years. 7. Data on educational attainment is highly reliable.
Challenges 1. We use the PES data to evaluate the census data, as we assume it’s correct, but the PES data have errors in fact. 2. Population aged 0-9 group has no comparable cohort, so it’s hard to assess the data quality.