Download
1 / 5
100 likes | 335 Views
Key findings Introduction. The survey group… 181 Columbia Business School students were surveyed regarding their wine consumption, buying habits, and its perception. As MBAs, the group may not be widely representative of their overall age category.

E N D
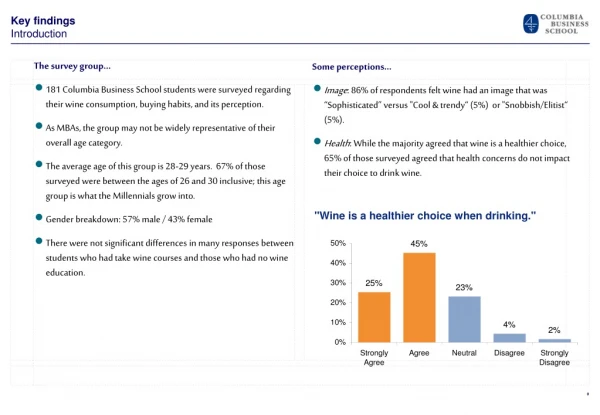
Key findingsIntroduction The survey group… • 181 Columbia Business School students were surveyed regarding their wine consumption, buying habits, and its perception. • As MBAs, the group may not be widely representative of their overall age category. • The average age of this group is 28-29 years. 67% of those surveyed were between the ages of 26 and 30 inclusive; this age group is what the Millennials grow into. • Gender breakdown: 57% male / 43% female • There were not significant differences in many responses between students who had take wine courses and those who had no wine education. Some perceptions… • Image: 86% of respondents felt wine had an image that was “Sophisticated” versus "Cool & trendy“ (5%) or "Snobbish/Elitist“ (5%). • Health: While the majority agreed that wine is a healthier choice, 65% of those surveyed agreed that health concerns do not impact their choice to drink wine.
Key findingsMotivation to drink wine Social behavior is an important factor… • 65% of respondents drinking wine 2 – 4 times per week or more. • 39% of those surveyed rank restaurants as the their primary venue for drinking wine, followed by groups and social settings. • 59% of respondents' friends drink wine, and 60% of respondents’ colleagues drink wine.
Key findingsBuying Habits • 67% of respondents buy wine once per week or more. Average spending has increased. • 61% believed they would drink more wine if they knew more about wine in general • Grape variety was first thing that 35% of respondents look for when buying wine, followed by Country of origin and Price. • Recommendations were another significant factor in the group’s wine purchases.
Survey CommentaryRespondents wish they knew more about… • Specifics (regions, varietals, producers) • “The names of one or two producers in each varietal that i can trust” • “Knowing the key differences between the main kinds/categories of wine” • Food Pairing • “Which wine goes better with the particular meal I have” • “How to pick the right bottle at a restaurant” • Tasting • “How to describe what i am tasting (i.e., oaky, smooth, etc.)” • “How to differentiate grape varieties only by tasting and smelling” • Vintages • “The vintage of great wine for each grape variety. It is so complicated to memorize it, but I think it’s worth it”
Survey CommentaryRespondents favorite thing about wine is… • Tasting/Experience • “The taste and smell” • “The taste for sure, as well as how well it works with food” • “The feeling it gives the drinker it is unmatched by any other type of alcohol” • “Such a sensual experience” • Social Aspect • “Wine is about people who make it and enjoy it” • “Its flexibility and adaptability to virtually any social situation” • “Best social drink ever...a group can enjoy it together and goes great with a meal” • “Finding a good wine to pair with a meal with friends, and then drinking a little too much of it :)” • Variety/Surprise • “Never know what I'm going to get... adds excitement!” • “The variety. I love experiencing new wines”