Enhancing Sustainability Investments in Extractive Industries: A Strategic Approach
This report outlines key findings from a $2 billion CAPEX project that highlights the value of early investments in sustainability, which can add $500 million over the life of the mine. Emphasizing collaboration across business functions, it introduces a tool for estimating net present values (NPVs) of sustainability investments, aiding in risk management and decision-making. By providing a framework for prioritizing investments, the approach reduces political risk insurance premiums by 50% in high-risk areas. This innovative model addresses integration challenges within operational and financial frameworks of the extractives industry.

Enhancing Sustainability Investments in Extractive Industries: A Strategic Approach
E N D
Presentation Transcript
Key Findings • Pilot: In a $2 billion (CAPEX) project, sustainability investments add $500 million value (including all costs) over life of mine. • Investments made very early (e.g., pre-feasibility) can yield such high return that it may be worth investing even before the “go/no-go” decision has been made on the project. Ex: local work force • The process brought business functions together in more collaborative ways, underscoring complementarities and inter-dependencies that were previously missed or under-recognized. • Financial platform provided a common language for communicating across business functions and decision-makers. • Several political risk insurers have stated that using this model on an iterative basis and thus demonstrating a strategic approach to managing project risks could reduce annual political insurance premiums by 50% in high risk countries
Challenge Being Addressed Challenge • Sustainability (CSR/local/social development) investments are not well-integrated into the extractives industry’s operational/financial models • Currently, there is no way to assess financial value and rationalize/ • optimize sustainability investments • It is difficult to communicate value of sustainability investments in • terms that internal and external constituencies can understand Solution • A tool that estimates expected net present values (NPVs) for a given project’s sustainability investment portfolio • Evidence-based customization and “plug-and-play” usability • Provide a framework for prioritizing, structuring, timing and • resourcing sustainability investments 2
What to Expect from this tool • What it can do: • Estimate (based on a range of probability) the expected NPV of a given portfolio of sustainability investments, including value-creation and value-protection components • Show relative benefit of specific investments (workforce vs. resettlement), to facilitate rational analysis and strategizing –> provide a strategic framework for decisions • Best used for comparing different portfolios and scenarios within one project by one company • What it can’t do: • It cannot accurately predict the precise NPV • Not really useful for comparing across companies or contexts, because assumptions would generally vary considerably • Provide an unbiased assessment of the quality of a sustainability investment 3
Understand the Key Sustainability Issues: Prioritize Issues 7
Sustainability Program: Results of Risk & Opportunities Assessment 8
Objectives of the Model • Provide expected range of NPVs for a portfolio of site-level sustainability investments" • The expected value is the sum of two separate calculations Indirect value (protection) refers to the indirect risk mitigation potential of sustainability investments. Direct value (creation) results from the direct cost-benefit of the sustainability investments. • Less risk of delay, disruption, and/or expropriation • Value protected is not readily calculated - e.g., investments in social cohesion, reputation, cultural heritage, etc. • Cost of inputs decreases or productivity rises • Value created can be readily calculated • e.g., workforce training enables substitution of local hires for expensive expatriates 10
Data Sources 11
Architecture of the Model • Architecture : The model is structured like a traditional business case, it estimates the difference between the value impact of two user-defined scenarios. In our pilot: • Scenario A is defined as “base case“ • Scenario B is defined as the proposed sustainability program for the • bauxite mine and alumina refinery in Africa Scenario A: user defined, e.g. business as usual Scenario B : user defined, most often a greater investment than scenario A, though this is not required. Estimated NPV of the sustainability investment portfolio under consideration. 12
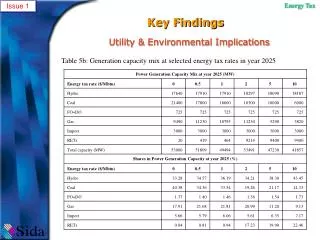
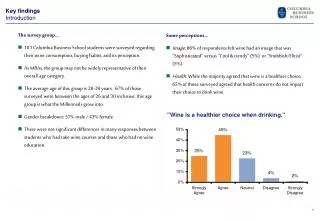
Pilot: greenfield bauxite mine and alumina refinery in Africa The Case study used is a Rio Tinto Alcan greenfield bauxite mine and alumina refinery in Africa Project design (realistic but not actual) cash flows are as follows: • 4 yr Construction phase: Capex = 2 billion $ total, 500 M$ per year • 64 yr Operations phase: 231 M$ annual opex and 740 M$ revenues • 3 yr Closure phase: 61.6 M$ closure costs per year Project Total design NPV, before applying the sustainability valuation methodology = 1,5 billion $ (Theoretical Present Value of the Mining project) 15
Pilot: Financial Model Output Occurrences • Monte Carlo is a: • Statistical technique by which a quantity is calculated repeatedly • Using randomly selected “what-if” scenarios. • Results approximate the full range of possible outcomes Value in Billions 16
Pilot: Sustainability revealed as a driver of Increased Profitability for the Project 17
Objectives of the Model Indirect value (protection) refers to the indirect risk mitigation potential of sustainability investments. Direct value (creation) results from the direct cost-benefit of the sustainability investments. • Less risk of delay, disruption, and/or expropriation • Value protected is not readily calculated - e.g., investments in social cohesion, reputation, cultural heritage, etc. • Cost of inputs decreases or productivity rises • Value created can be readily calculated • e.g., workforce training enables substitution of local hires for expensive expatriates 18
Step 2: Risk (Value Protection) Assumptions For each risk, the sustainability/risk/finance professionals can define multiple intervals of time to reflect changing conditions (e.g. split a 6 year construction phase into two 3-year intervals) For each interval of time, the expert group enters min-likely-max values for: • likelihoodof occurrence (during the interval as a whole); • financial consequence of each risk, through its duration, one-time and/or recurring costs during the delay, lost production, etc • Assumptions regarding likelihood of occurrence of specific risks: • Occurrence of each risk has been derived (though not statistically calculated) from the fact based, but adapted to specific project risks conditions • The occurrence was informed by qualititatve remarks regarding the level of risk occurring at specific interval of time (e.g., start of construction = higher risk phase) as well as by external regerence (e.g., MIGA reference for expropriation) 20
Step 2:Risk (Value Protection) Assumptions, cont b) Assumptions regarding duration, one-time cost and recurring cost related to each specific risk: • Observations in the fact base have been used to identify: • Plausible ranges of duration for delays • Plausible ranges of one-time costs (e.g., management time, lawyers fees) as well as other plausible ranges of values • The basis of recurring costs (e.g.: % of salaries, % of overhead costs, % of lost revenues) as well as their plausible range of values • Project cash flows (revenues & costs) are shifted as a whole as a result of delays, and all costs translated into cash flows 22
Step 4: Risk Reduction Factor • Sustainability Program can reduce the level of sustainability risks by reducing their occurrence, duration and financial impact. • Two key parameters have been used to determine the risk reduction potential of sustainability investments: • Issue Importance: reflects the relative weight of each issue evaluated by project teams stakeholder engagement process and company subject matter experts. • The Quality of Sustainability Program for Scenario B (Step 3) 26
Step 5: Context Specific Sensitivity Factor • It has been recognized through the Fact Base and the interviews process that some sustainability risks, such as the risk of expropriation, are primarily related to macro political issues and not so much to sustainability investments. • In order to be conservative in our value protection estimates, we have introduced a Sensitivity factor which reflects the risks’ sensitivity to Sustainability programs (e.g. expropriation risk has been estimated to be only 20% sensitive to Sustainability Issues) • These numbers also need to be revised in subsequent phases of the project. 27
Step 6: Total Impact of Risk Calculation of the total impact of risks (value protection): • A riskreduction factor isapplied, based on the the relative weights of the sustainability issues and the quality of the sustainabilityinvestment • A sensitivity factor isapplied to onlyaccount for the portion of the risksthatcanbeaddressed by sustainabilityinvestments • Risks are translated into financial impacts (effects on production, increased costs, net cash flows, based on risk=probability*consequence) and the resulting NPV is calculated. • The financial impact of these risks is estimated through Monte Carlo simulation, to reflect the variability in the inputs. 28
Comments on Value Protection • Evaluation of the Value protected is the most complex element of the Model • Multiple assumptions were made in order to come up with the final inputs for this pilot. Although they are out best estimates so far, they need further refinement through: • Systematic Qualitative assessment methodologies used in baseline studies (e.g. ESIA), which could be beneficially used in order to populate assumptions necesssary for the Model • Engagement of additional project pilots, which could bring together expert panel groups to estimate the necessary inputs to strengthen the following: • Sustainability Risk Assumptions • Quality Matrix • Risk Reduction Factor and Sensitivity Factors 30
Sustainability Investment Portfolio Evaluation: Value Creation 34
Capex 2B, sustainability investments adding 517 million of direct and indirect value (costs included) 35
Wrap-up: What the Tool Provides • A tool that estimates expected net present values (NPVs) for a given project’s sustainability investment portfolio • Evidence-based customization and “plug-and-play” usability • Process that leads to harmonization of strategies across business functions • Selecting /prioritizing the right sustainability projects (which bring the most value for the company and stakeholders) • Choosing the scale and timing of sustainabilityinvestments • The best time to use the Model is in early planning phases • Potential positive ripple effect: e.g. reductions in political risk insurance premiums 36
Areas for Further Refinement • Expand applicability to a variety of projects (breadth of Sustainability issues covered, etc) • Expand the fact base of extractive industryprojects • Test the model with new pilots • Refine some methodological steps & assumptions: • Double counting of risks/impacts • Quality of Sustainability program (-2 to +5) • Risk assumptions (likelihood, consequence) • Risk reduction factor • Sensitivity factor • Improve Usability 37
Why Participate in Piloting the Model? • Benefits from participating: • Access to technical support and expertise from IFC, Deloitte, Rio Tinto • Leverage available funds and get a pilot study at a fraction of real costs • Leverage the tool to demonstrate the value of sustainability investments within a difficult economic context • Strengthen then a key strategic project with a better sustainability program 38