Download
1 / 33
330 likes | 525 Views
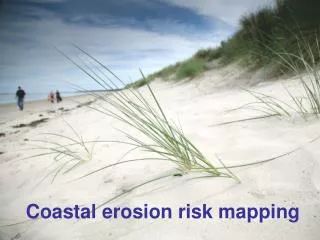
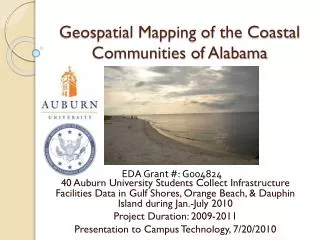
A GIS-Based Approach to Risk Mapping in Coastal Communities. David M. Bush Chester W. Jackson Jr. Department of Geosciences State University of West Georgia. Purpose. To create risk maps to be used as an aid for:. hazards evaluations risk assessments

E N D
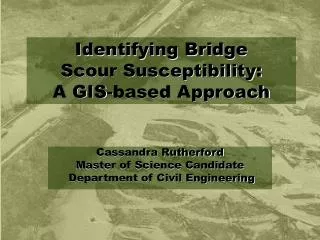
A GIS-Based Approach to Risk Mapping in Coastal Communities David M. Bush Chester W. Jackson Jr.Department of GeosciencesState University of West Georgia
Purpose To create risk maps to be used as an aid for: • hazards evaluations • risk assessments • property damage mitigation recommendations • pre and post-storm reconstruction plans • training of coastal managers
Risk Map Fundamentals • Multiple layers of environmental and hazard potential data incorporated into one map • Integration of GIS applications • Public distribution of final output map and data in digital and paper copies
Methods • Construct a library of data files for each area with appropriate GIS coverages • Edit each coverage by assigning numerical attributes to polygons in ArcView • Merge coverages using ArcInfo and inspect for errors within each new polygon created • Build an ArcView project for data display
Dell OptiPlex GX1 Pentium II workstation ArcView GIS v. 3.2 ArcInfo v. 8.2 CalComp digitizing tablet ENVI Adobe Photoshop v. 5 Adobe Illustrator v. 9 Microtek 9600XL graphic scanner Yamaha CD- Recordable drive Software and Equipment
Target Projection Parameters • UTM projection • Zone 17 • NAD 1983 • meter units • GRS 1980 spheroid
Vegetation Layer • Source: Georgia GIS Data Clearinghouse • Landsat TM Imagery • maritime forest • dense shrub • scattered shrub • none, sparse, marsh
Q3 Flood Layer • Source: FEMA • FEMA Q3 Flood Data ArcInfo Coverages • “X” zone • “A” zone • “AE” zone • “X500” zone • “VE” and “UNDES” zone
S.L.O.S.H. Layer • Source: U.S. Army Corp of Engineers • S.L.O.S.H. ArcView shapefiles • Category 1-3 • Category 4-5 and upland
Risk Map • Union of Vegetation, Q3, and S.L.O.S.H coverages and creation of new polygons • New polygons contain a value which is the sum of numerically attributed polygons from each layer • 4 categories of risk: low, moderate, high, and extreme
Evaluation of Map Data Testing hazard zone applicability and selecting field sites • Look at transition areas between risk zones • Inspect the validity of geo-indicators inside risk zones while at each field site • Look for evidence of historical storm events • Take pictures of each site and write a brief description of the area
Elevation Vegetation Tidal range Bluff configuration Evidence of historical storm impacts Type of structures Density of structures Site relative to stream mouth Soil and drainage Other surrounding features Geo-indicators
Preparation of a Final Risk Map • Transportation coverages are added to assist with navigation to field sites • Hydrography coverages are added to distinguish between upland, marsh, and open water areas • Adjustments to specific polygons can be made based on field observations
Future Work • Statistical analysis of risk maps to determine which geo-indicators mainly affect risk potential and which are less important • Continued site selection and monitoring of old sites • Update and distribute new risk maps as new data becomes available • Interactive cd-rom
Acknowledgements • John Congleton • Amy George • Brian Schultz • Elizabeth Souligney • Craig Okraska