Chapter 12- Sustaining Aquatic Biodiversity
720 likes | 878 Views
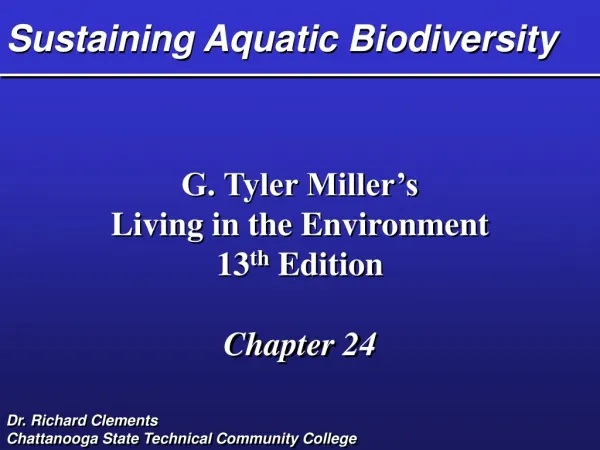
Chapter 12- Sustaining Aquatic Biodiversity. Lake Victoria. SUDAN. ETHIOPIA. AFRICA. KENYA. LAKE VICTORIA. BURUNDI. ZAIRE. TANZANIA. Figure 13-1 Page 251. Shared by countries Source of Nile, which flows into the Mediterranean Sea

Chapter 12- Sustaining Aquatic Biodiversity
E N D
Presentation Transcript
Lake Victoria SUDAN ETHIOPIA AFRICA KENYA LAKE VICTORIA BURUNDI ZAIRE TANZANIA Figure 13-1Page 251
Shared by countries • Source of Nile, which flows into the Mediterranean Sea • Until early 1980s- more than 350 fish species- lots of cichlids
Current Status • 1 Native minnow species ad two introduced fish species dominate the lake • The rest are endangered or extinct • What caused this?
Causes…. • Nile Perch- 1960 deliberate introduction • They have eat the cichlids, the native shrimp and even their own young. The fear is that the fishery may collapse • The locals can not even afford this fish!
Causes… • Eutrophication • Depleted oxygen at depths • Drove cichlids to greater depths where they are more vulnerable • Invasion by the water hyacinth • Blocks sunlight • Deprives organisms of O2 • Reduces diversity of plants • Effects boats • Stagnant water- breeding ground for mosquitoes
Causes… • Tanzania- gold mine • Uses cyanide to obtain gold
What can be done? • Slow down population growth • Reforestation along shores
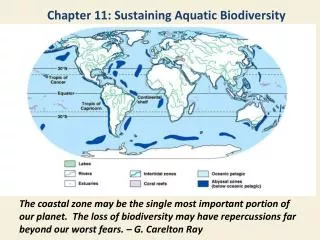
Water World • 71 % of planet’s surface • 99 % of the living space of biosphere • 25,000 known fish species • 63 % in marine systems • 37 % in fresh water
Cobia Hogfish Kelp Pacific sailfish Carrageen Moray Yellow jack Red snapper Red algae Batfish Bladder kelp Striped drum Angelfish Chinook salmon Sea lettuce Orange roughy Devilfish Porcupine fish Great barracuda Laminaria Sockeye salmon Grouper Figure 13-2Page 253 Chilean sea bass Dulse
Brook trout White waterlily Bluegill White bass Bulrush Muskellunge Rainbow trout Rainbow darter Water lettuce Bowfish Water hyacinth Bladderwort Largemouth black bass Black crappie White sturgeon Yellow perch Velvet cichlid American smelt Walleyed pike Eelgrass Longnose gar Duckweed Common piranha Carp Egyptian white lotus Channel catfish Figure 13-3Page 254 African lungfish
Marine Biodiversity • Highest in coral reefs and deep sea • Middle depths of ocean probably have lowest diversity • Keystone top predators are in many marine intertidal zones- top down web dynamics • Upwelling- bottom up web dynamics
Importance • Instrumental • 6 % total human protein • 16 % of animal protein from fish species • Seaweed- cosmetics ($400 million per year) • Medicinal properties • Intrinsic
Human Impacts • Species loss and endangerment • Over fishing • Habitat destruction • Pollution • More vulnerable than land organisms • Marine habitat loss and degradation • Loss of coastal wetlands • Loss of coral- 70 % loss in the next 50 years? • Pollution • Loss of mangroves • Beach erosion- development • Dredging operations • Deep sea mining
Human Impacts • Freshwater Habitat Loss and Degradation • Loss of inland wetlands- development • Large rivers fragmented or dammed up (endangers many fish) • Flood control levees alter habitats • Overfishing • 2001 study- UN Food and Agriculture Organization- 75 % of the world’s 200 commercially valuable fish are over harvested • Can lead to commercial extinction- then they shift to other fish, which can disrupt food webs even more • Depletion / extinction of other species
Global freshwater 3.5 3.4 3.3 3.2 3.1 3.0 Mean trophic level 2.9 2.8 2.7 2.6 Figure 13-4aPage 255 2.5 1950 1960 1970 1980 1990 Year
Global marine 3.5 3.4 3.3 3.2 3.1 Mean trophic level 3.0 2.9 2.8 2.7 2.6 Figure 13-4bPage 255 2.5 1950 1960 1970 1980 1990 Year
Human Impacts • Nonnative Species • Deliberate or accidental • Disrupt ecosystems • Asian swamp eel- waterways of South Florida • Eats a lot of things • Burrows into mud- avoids capture, cold • Can breathe air- wriggle across land • Pollution and Global Warming • Oil • Acid Deposition • Excess plant nutrients • Toxic chemicals • Development • Sedimentation • Global warming- could later feeding patterns • Increase temperatures • Raise sea levels- destroy mangroves, etc.
Nonnative Present Not present Figure 13-5Page 256 No data
Why is protecting difficult? • What do you think?
Difficulties • Development • Lack of international treaties • Open-access resources- Our friend Garrett Hardin
What should we do? • Protect endangered species • Establish protected areas • Integrated coastal management • Prevent ocean pollution • Sustainably manage fisheries
Bowhead whale Bowhead whale Bowhead whale Humpback whale Northern right whale Bowhead whale Saimaa seal Northern right whale Fin whale Hawksbill turtle Mediterranean monk seal Japanese sea lion Kemp's ridley turtle Humpback whale Hawksbill turtle Fin whale Hawksbill turtle Olive ridley turtle Olive ridley turtle Leatherback turtle Olive ridley turtle Hawaiian monk seal Green turtle Green turtle Leatherback turtle Leatherback turtle Leatherback turtle Humpback whale Green turtle Hawksbill turtle Green turtle Humpback whale Hawksbill turtle Hawksbill turtle Humpback whale Leatherback turtle Fin whale Fin whale Whale Turtle Seal Sea lion Figure 13-6Page 258
Protect the Endangered • Sea Turtles- • Loss o beach • Trade • Taking of eggs • Capture by fishing boats- shrimp trawlers (bycatch)- Figure 24-9 for TED • International Treaties- CITES • 1979 Global Treaty on Migratory Species • US Marine Mammal Protection Act of 1972 • US Endangered Species Act of 1973 • Whale Conservation and Protection Act of 1976 • 1995 Convention on Biological Diversity
Olive ridley 76 centimeters Australian flatback 99 centimeters Loggerhead 119 centimeters Hawksbill 89 centimeters Black turtle 99 centimeters Green turtle 124 centimeters Leatherback 188 centimeters Kemp's ridley 76 centimeters Figure 13-7Page 258
Whaling • 1925-1975- 1.5 million whales killed • Drove 8 out of the 11 major species to major extinction • Some whales- Blue Whale driven to biological extinction • 1946- International Whaling Commission- annual quotas- quotas not always the best • Japan, Norway and Iceland still hunt whales • In Japan- it could cost up to $90 per pound
0 5 10 15 20 25 30m 0 10 20 30 40 50 60 70 80 90 100ft Atlantic white-sided dolphin Common dolphin Harbor porpoise Killer whale Bottlenose dolphin Beluga whale False killer whale Cuvier's beaked whale Pilot whale Narwhal Pygmy sperm whale Sperm whale Baird's beaked whale Squid Figure 13-8aPage 260 Odontocetes (Toothed Whales)
Humpback whale Bowhead whale Minke whale Right whale Blue whale Fin whale Feeding on krill Sei whale Figure 13-8bPage 261 Gray whale Mysticetes (Baleen Whales)
The arguments • For Whaling • Traditional • Some whale species are coming back • Against Whaling • Right to live • Questionable estimates of whales • Could lead to widespread harvest
Marine Sanctuaries- Good stuff • All nations have rights to sea up to 19 km (12 miles) • Almost total jurisdiction over the EEZ (Exclusive Economic Zone)- 230 km (200 miles) offshore • This accounts for 36 % of oceans and 90 % of fish stocks • US- 12 marine sanctuaries • Since 1986- World Conservation Union- MPA (Marine Protected Areas) to protect about 0.2 % of world’s ocean area- this is mostly at the national level
Marine Sanctuaries- Not so good stuff • Less than 0.01 % of ocean area is fully protected • MPAs are usually too small • Usually some extraction type activities are allowed here, that are not in marine reserves
In Marine Reserves • Fish populations double • Fish grow larger • Fish reproduction triples • Diversity is 23 % higher
Integrated Coastal Management • Community based way to manage resources sustainably • Identify shared problems • Work toward a group solution • Zone coastal areas and allow different activities in different zones
What can be done about Beach Erosion? • Maybe 70 % of the world’s beaches are eroding • Causes: • Sea level rise • Redirecting of rivers • Extracting groundwater • Draining wetlands • Diverting water to the oceans
Solutions? • Looking to prevent construction of jetties, etc. • Limit development • Cut down on federal flood insurance subsidies
Fisheries • Developing better measurement techniques for determining fish population sizes and how to extract them • MSY • OSY- Optimum • Multispecies management • Large marine system management • Precautionary Principle
MSY • Difficult to determine growth rates, because they change • Fishers may lie or underreporting • If followed, there is little room for error • Quotas are difficult to enforce • OSY- takes into account interactions with other species
Public Management or Private Ownership • International and National Laws • Community Based Comanagement • Individual Transfer Quotas
Country’s Offshore Zone • Extends 370 km from shore • Foreign ships can take some catch in the exclusive economic zone- only with government permission • High seas are outside of this
Enforcement is even more difficult with the arrival of more advanced technology • Comanagement- government and community working together
What else can be done • Fishery Regulations- • Monitor fishing catch • Divide up fishing quotas • Require selective gear to limit bycatch • Improve enforcement- satellites • Economic • Reduce / eliminate subsidies • Impose fess for harvesting in publicly owned areas • Certify sustainable fisheries • Bycatch • Better equipment as well as finding ways to reduce the actual catching • Allow harvesting of more than one species- so as not to waste edible fish
What else can be done • Protected Areas • Establish no fishing areas • Protect habitats in good condition • Nonnative Invasions • Disinfect ballast water • Dump ballast further out at sea • Consumer Information • Include labels on food that tell consumers if the food was raised sustainably • Aquaculutre • Restrict location of fish farms / pollution • Herbivorous fish
Solutions Managing Fisheries Fishery Regulations Set catch limits well below the maximum sustainable yield Improve monitoring and enforcement of regulations Economic Approaches Sharply reduce or eliminate fishing subsidies Charge fees for harvesting fish and shellfish from publicly owned offshore waters Certify sustainable fisheries Protected areas Establish no-fishing areas Establish more marine protected areas Rely more on integrated coastal management Consumer Information Label sustainably harvested fish Publicize overfished and threatened species Bycatch Use wide-meshed nets to allow escape of smaller fish Use net escape devices for seabirds and sea turtles Ban throwing edible and marketable fish back into the sea Aquaculture Restrict coastal locations for fish farms Control pollution more strictly Depend more on herbivorous fish species Nonnative Invasions Kill organisms in ship ballast water Filter organisms from ship ballast water Dump ballast water far at sea and replace with Deep-sea water Figure 13-9Page 263
Wetlands • In US you need a federal permit to fill in a wetland larger than 3 acres • Mitigation Banking- allows you to destroy one if you create another
Solutions Protecting Wetlands Legally protect existing wetlands Steer development away from existing wetlands Use mitigation banking only as a last resort Require creation and evaluation of a new wetland before destroying an existing wetland Restore degraded wetlands Try to prevent and control invasions by nonnative species Figure 13-10Page 265
Kissimmee River ( ) ( ) miles 20 40 60 0 0 20 40 60 kilometers Florida Everglades Channelized Unchannelized FLORIDA Lake Okeechobee West Palm Beach Fort Myers GULF OF MEXICO Naples Fort Lauderdale Agricultural area Treatment marsh Water conservation area Miami Canal Everglades National Park ATLANTIC OCEAN FLORIDA Key Largo Florida Bay Figure 13-11Page 267 Area of detail
Houses 56 endangered or threatened species • It was once a 110 km wide section of water • But, then the waterways were altered
Levees, canals, and straightening of rivers • Water was drained from wetlands, and land was turned into cow pastures • Agriculture- sugarcane and vegetables • Phosphorous runoff- stimulated growth of cattails • Cattails- taken over, disrupted food webs • Half the original area remains- susceptible to wild fires
1947- Everglades National Park • Didn’t work because of the water supply which was cut of by development to the north • What do you think has happened to the salt levels in the bay in the park? And, what do you think the run-off has done to the aquatic systems?