Download
1 / 12
120 likes | 232 Views
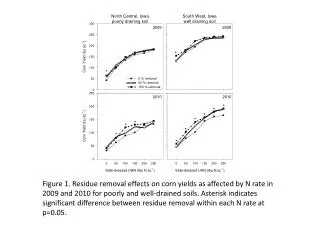
Figure 1. Residue removal effects on corn yields as affected by N rate in 2009 and 2010 for poorly and well-drained soils. Asterisk indicates significant difference between residue removal within each N rate at p=0.05.

E N D
Figure 1. Residue removal effects on corn yields as affected by N rate in 2009 and 2010 for poorly and well-drained soils. Asterisk indicates significant difference between residue removal within each N rate at p=0.05.
Figure 2. Residue removal effects on corn yields as affected by tillage in 2010 for poorly and well-drained soils. Different letters indicate significant difference between residue removal and tillage at p=0.05.
Figure 3. Total soil carbon as affected by two years of residue removal for poorly and well-drained soils. Different letters indicate significant difference between residue removal at p=0.05.
Figure 4. Potential changes to net soil organic carbon from carbon input from above- and below-ground biomass minus losses from microbial respiration to a depth of 15 cm. Carbon budget was conducted in 2010 in a well-drained soil and poorly-drained soil under different tillage and N fertilization regimes.
Figure 5. Soil bulk density as affected by two years of residue removal and tillage systems for poorly and well-drained soils. Different letters indicate significant difference between residue removal and tillage at p=0.05.
Figure 6. Aggregate mean weight diameter as affected by two years of residue removal, tillage and nitrogen rate systems for a poorly-drained soil site. Different letters indicate significant difference between residue removal, tillage and nitrogen rate at p=0.05.
Figure 7. Steady water infiltration rates as affected by residue removal and tillage for poorly and well-drained soil sites. Different letters indicate significant difference between residue removal and tillage at p=0.05.
Figure 8. Potential sink or source for Atmospheric CO2-C . • Include above ground biomass, grain, and root biomass for ANPP • (ANPP + BNPP) – Rh • Positive values indicate a sink for atmospheric CO2
Figure 9. Seasonal CO2 emissions under different residue removal and tillage management in 2009 and 2010 for the poorly drained soil site in Ames.
Figure 10. Seasonal N2O emissions under different tillage management in 2009 and 2010 for the poorly drained soil site in Ames.
Figure 11. Mean annual N2O emissions under different corn residue removal management in 2009 and 2010 for the poorly drained soil site in Ames.
Table 1. Effect of N fertilizer Rate on Corn Biomass N and C Content at Plant Maturity Across Sites, 2009-2010 (John Sawyer and Jose Pantoja).