Download
1 / 20
200 likes | 377 Views
Introduction. Galaxy Cluster EnvironmentMostly red, passively evolving galaxiesButcher-Oemler effectBlue field galaxies added over timeQuenched Star FormationRam StrippingHarassment/CollisionsStrangulation. Introduction. Z=0.545Most Disturbed Cluster known at z>0.5One of most massive clusters at z>0.5Dynamic activity on many spatial scales: filaments, cluster mergers.

E N D
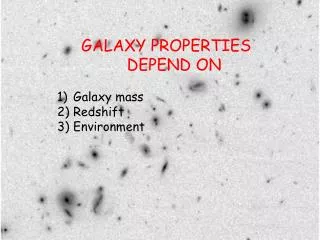
1. Galaxy Properties in MACSJ0717.5+3745 as a Function of Cluster Environment Jeff Rich
Adviser: Harald Ebeling
2. Introduction Galaxy Cluster Environment
Mostly red, passively evolving galaxies
Butcher-Oemler effect
Blue field galaxies added over time
Quenched Star Formation
Ram Stripping
Harassment/Collisions
Strangulation
3. Introduction Z=0.545
Most Disturbed Cluster known at z>0.5
One of most massive clusters at z>0.5
Dynamic activity on many spatial scales: filaments, cluster mergers
4. Data ACS data in two bands: F606W, F814W
3 x 6 pointings
10 X 20 arcmin, 3.8 x 7.6 Mpc
Used to investigate color
Keck/DEIMOS spectra
~700 spectra in ACS field
5. Data
6. Data Analysis SExtractor
Source Detection with F814W image
Magnitudes calculated in both bands
Kron aperture & Fixed aperture
Object Selection
HST sources correlated with DEIMOS spectra
Cluster members spectroscopically selected using DEIMOS spectra
7. Data Analysis Stars/Galaxies flagged
Catalog cleaned for I814 < 22.5
Maximum spectroscopic completeness for I814 < 21.2
8. Map of Cluster Members 434 Spectroscopically confirmed cluster members covering wide spatial range
9. Data Analysis Color Selection:
Galaxies assigned �red� or �blue� status
Blue galaxies: more recent or active star formation
Color selection based on red sequence
�Generous� and �Conservative� selection
2? and 1? width red sequences
Blue galaxies 2? and 3? blueward of red sequence
10. Data Analysis Color Selection:
Galaxies assigned �red� or �blue� status
Blue galaxies: more recent or active star formation
Color selection based on red sequence
�Generous� and �Conservative� selection
2? and 1? width red sequences
Blue galaxies 2? and 3? blueward of red sequence
11. Data Analysis
12. Data Analysis
13. Data Analysis 1-D color distribution:
Investigate simple Color-Density relation
Cluster members assigned clustercentric distance based on x-ray center
Surface density of cluster members
Fractional number of red or blue galaxies
14. Data Analysis
15. Data Analysis
16. Data Analysis
17. Data Analysis 2-D Color Distribution
Investigate spatial distribution of color
Manually binned 2-D histogram of all cluster members, minimum of 19 members/bin
18. Data Analysis 2-D Color Distribution
Generous Color Cut
Red (top) or
Blue (bottom) fractional number of galaxies per bin
19. Data Analysis 2-D Color Distribution
Conservative Color Cut
Red (top) or
Blue (bottom)
fractional number of galaxies per bin
20. Discussion Star formation quenched
Mechanism?
Unique features
Red galaxies far from cluster core
Blue galaxies in filament
Blue galaxies in outskirts
Match field?
21. Future Work Photo z/incompleteness
Morphological concerns
Unique to HST
Quantitative SF diagnostics