Download
1 / 30
300 likes | 313 Views
Investigating star formation history and activity in distant galaxy clusters at different redshifts. Analysis of galaxy properties and environments using EDisCS survey data and spectroscopy. Examining the correlation between star-forming galaxies, cluster mass, and environmental factors.

E N D
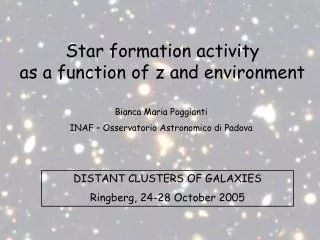
Star formation activity as a function of z and environment Bianca Maria Poggianti INAF – Osservatorio Astronomico di Padova DISTANT CLUSTERS OF GALAXIES Ringberg, 24-28 October 2005
The ESO Distant Cluster Survey (EDisCS)Study evolution of cluster galaxies and clusters in 20 fields with clusters at z=0.4 – 1.0 P.I. S. White ( MPA-Garching, D )A. Aragón-Salamanca ( Nottingham, UK )R. Bender ( Munich, D )P. Best ( ROE, Scotland )M. Bremer ( Bristol, UK )S. Charlot ( MPA, D & IAP, F )D. Clowe ( Bonn, D)J. Dalcanton ( U.Washington, USA )B. Fort ( IAP, F )P. Jablonka ( OPM, F )G. Kauffmann ( MPA, D )Y. Mellier ( IAP, F )R. Pello ( OMP, F )B. Poggianti ( Padova, I ) H. Rottgering ( Leiden, NL )P. Schneider ( Bonn, D )D. Zaritsky ( U. Arizona, USA )M. Dantel ( OPM, F )G. De Lucia ( MPA, D )V. Desai ( U. Washington, USA )C. Halliday ( Padova, I )B. Milvang-Jensen ( MPE, D )S. Poirier ( OPM, F )G. Rudnick ( MPA, D )R. Saglia ( Munich, D )L. Simard ( U. Victoria, C )J. Varela ( Padova, I)
CL1037.5-1243 z=0.58 CL1054.4-1245 z=0.75 CL1354.1-1231 z=0.76 CL1202.4-1224 z=0.42 CL1232.3-1250 z=0.54 EDisCS Imaging
THE DATASET • Deep imaging: VRIJK at z~0.8, BVIK at z~0.5 (FORS2/VLT + SOFI/NTT) (White et al. 2005) • HST/ACS imaging for 10 most distant clusters (80 orbits) • WFI/2.2m RVI imaging for all 20 fields • XMM data for >=3 clusters • Spectroscopy: at least 4 FORS2 masks/cluster at long exposure to get spectra to I~23 (z~0.8) or 22 (z~0.5)
Spectroscopy 25 nights of FORS2 MXU spectroscopy average of 35 members/cluster • z’s to I~23 (over ~3.5mag) • Line strength to I~22.5 • ’s to I~21.5
Redshifts, σ’s +substructure analysis Halliday et al. 2004
Spectroscopy: the sample Halliday et al. 2004 and Milvang-Jensen et al. in prep.
Spectroscopy: the sample Halliday et al. 2004 and Milvang-Jensen et al. in prep. For this work, 16 clusters, 10 groups and 250 galaxies in poor groups and the “field”.
Deriving the fraction of star-forming galaxies Galaxies with EW(OII)>3 Å Non trivial: • no bias in galaxy sample • corrected for completeness • within R200 (mean density 200 times the critical density) and to appropriately evolving galaxy magnitude limits • good spectral quality and sufficient number of spectra per cluster
EDisCS: [OII] – sigma relation Poggianti et al. submitted z = 0.4 to 0.8 Fraction of galaxies with [OII] emission • Most clusters on a stripe • Outliers • Anticorrelation or upper envelope? • At a given cluster σ, AT MOST a given % of star-forming galaxies – or AT LEAST a certain % of passive galaxies • Suggests dependence SF-Mass of the system, but might well be a secondary relation – density? (e.g. existence of outliers) Fraction of members with OII within R200 500 1000 Velocity dispersion
Residuals of the OII relation with redshift Residuals from OII-sigma relation Redshift
Evolution with z of the % of SF-ing galaxies EDisCS: z = 0.4-0.8 Sloan (Abell): z = 0.04-0.1 The fact that distant clusters contain more SFing galaxies than nearby clusters is not new of course. But for the first time, evolution is quantified as a function of the system mass At z=0, trend with sigma remains only at < 500 km/s ?
Evolution with z of the % of SF-ing galaxies EDisCS: z = 0.4-0.8 Sloan (Abell): z = 0.04-0.1 These results might explain why it has been difficult to detect and quantify evolution (eg Kodama et al. 2004, Finn et al. 2004,2005, Nakata et al. 2005) and the apparently constrating results regarding the presence (Martinez et al. 2002, Biviano et al. 1997, Zabludoff & Mulchaey 1998, Margoniner et al. 2001) or absence (eg Ellingson et al.2001, Smail et al. 1998, Goto 2005, Wilman et al.2005) of clear correlations with global cluster properties
Evolution of the OII-sigma relation How are these trends established? Why a general trend at z=0.8, and a broken one at z=0? What is special about a 500 km/s system at z=0?
Other environments: GROUPS -- > 7 spectroscopic members, measured sigma POOR GROUPS - 3 to 6 spec. members, no sigma FIELD – anything not in clusters, groups or poor groups Field Poor groups 0.4 0.8 0.4 0.8 Redshift distributions
EDisCS: [OII] – sigma relation Z=0.4 to 0.8 Fraction of galaxies with [OII] emission Groups “close” to clusters different from “isolated” groups? Another hint for density? Cluster velocity dispersion
EW(OII) distributions in different environments The % of starforming galaxies changes with environment and z Does the SF activity in SFing galaxies change with environment? (only EDisCS) The EW([OII]) distribution is more skewed towards high values in environments with higher [OII] fractions. We find that BOTH the EWs at a given L and the luminosity distribution of SFing galaxies vary with environment.
Star formation vs Hubble type Hubble types; visual classification from HST images (10 clusters, Desai et al.) Early/Late types: B/D decomposition from VLT images (all 20 fields, Simard et al.)
EDisCS: Galaxy morphologies with HST Evolution from spirals to S0s in clusters(Dressler et al. 1997, Fasano et al. 2000, Treu et al. 2003, Postman et al. 2005, Smith et al. 2005) Sp+Irr % E+S0 % S0 % E % Desai et al. in prep. 0.0 0.8 Redshift
Morphology-density at z~1 f_Sp+Irr f_S0 f_E f_E+S0 Postman et al. 2005 projected density
STAR-FORMATION versus MORPHOLOGY Sp+Irr E+S0 S0 E % SF-ing: SF-ing spirals (85%) Spirals: SF-ing spirals (87%) and and SF-ing E+S0s (15%) passive spirals (13%)
The origin of the observed trends: star formation activity and structure growth
Origin of the OII-sigma relation If SF depends on the mass of the system, there should be a connection between the SF trends and the growth history of structures Press-Schechter (Bower 1991, Lacey & Cole 1993) for mass fraction Millennium Simulation (Springel etal 05,De Lucia et al. 2005) for galaxy fraction Two families of passive galaxies: “primordial” passive galaxies that completed their SF at z>2 “quenched” galaxies that stopped forming stars after they entered the dense environment for the first time What drives the existence and the evolution of the [OII]-sigma relation?
HIGH REDSHIFT (z=0.4-0.8) When primordial galaxies finished forming stars (z>2), the most massive systems were groups (M > 3 X 10^12) • The fraction of passive galaxies observed at high-z agrees with the fraction of mass/galaxies that were already in groups (M > 3 X 10^12) at z=2.5
LOW REDSHIFT the break at ~500 km/s observed at z=0 corresponds to M~10^14 : reference mass for efficient quenching 3 Gyr a reasonable upper limit for quenching timescale • The fraction of passive galaxies observed at low-z agrees with the fraction of galaxies in clusters (M > 10^14) at z~0.28 (3 Gyr before observations) • Of these, 20% are primordial passive galaxies and 60% are quenched galaxies • “Group” environment (M << 10^14) cannot efficiently and universally quench star formation
SUMMARY • The [OII]-sigma relation suggests that at high-z the proportion of star forming galaxies largely depends on the mass of the system (mass or density?) • Significant evolution in the star forming fraction between z=0.8 and z=0 in clusters and groups, and quantify evolution as a fn. of sigma • At z=0, no trend of [OII] fraction with sigma above ~500 km/s • At high redshift also the EW([OII]) distributions vary systematically with environment • The evolution of the star forming fraction is consistent with the evolution of the fraction of spirals
CONCLUDING REMARKS • Possible link between the star formation activity in galaxies and the history of growth of clusters and groups: In a scenario in which the passive galaxy populations have two components (primordial and quenched galaxies): • consistency between fractions of passive galaxies at high-z and expected fractions of mass/galaxies already in groups at z=2.5 • consistency between fractions of passive galaxies at low-z and expected fractions of mass/galaxies that have experienced the cluster environment for a few Gyr • The observed [OII] trends at low-z seem to rule out the hypothesis that groups efficiently and universally quench star formation. Conversely, they show that the quenching is not limited to very massive clusters. • Not all “trends with environment” are necessarily due to environmental processes truncating star formation in recently accreted galaxies. Role of “primordial conditions”.