Download
1 / 10
100 likes | 239 Views
Emission Measure Distributions: A Tutorial Nancy S. Brickhouse Harvard-Smithsonian Center for Astrophysics. New England Space Science Cambridge, MA March 1, 2006. From Spectral Lines to Emission Measures Emission Measure Distributions of Different Stars Hot Research Questions

E N D
Emission Measure Distributions: A TutorialNancy S. BrickhouseHarvard-Smithsonian Center for Astrophysics New England Space Science Cambridge, MA March 1, 2006 • From Spectral Lines to Emission Measures • Emission Measure Distributions of Different Stars • Hot Research Questions Coronal Structure Coronal Abundances Coronal heating: flares and nanoflares
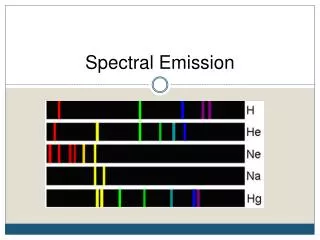
We use UV, EUV, and X-ray Lines from log T = 4.0 to 8.0 From Spectral Lines to Emission Measure Chandra
Line Flux = ∑ε (T) EM(T) / (4 π R2), where R is the distance, EM (T) = ∫ Ne NH dV is the emission measure, and ε (T) depends on a lot of atomic physics, e.g. ionization and recombination rates collisional excitation rates radiative decay rates AND we make a number of assumptions, such as negligible optical depth collisional ionization equilibrium
I .Understanding Coronal StructureRotation and ActivityEvolution Hot Research Questions Sun (G2 V) Yohkoh Image Capella (G8 III + G1 III); Expanding Loops?
Electron Density Determination Lower Pressure; L=.02 R* High Pressure; L=.003 R* Chandra Gratings Capella • Compelling evidence for high density, small emitting region(s) • Multiple pressures in the system
Hot Research Questions II. Abundances: Continuum and Line Modeling HR 1099 High Neon Abundance An Inverse FIP Effect?
Hot Research Questions III. Coronal heating: flares > 1 day flare with exponential decay Eclipse gives the extent of the flare loop Algol
Hot Research TopicsIII. Coronal heating: nanoflares IEUVΩEUV [Te] —— = ———— exp (-ΔE/kTe) IX-ray ΩX-ray[Te] 6 MK EMD peak Discrepancies are not explained by: atomic rate uncertainties calibration uncertainties absorption time variability
Breaking the Assumptions of Emission Measure Distribution Analysis We consider episodic heating (nanoflares) with: - heat input to the chromosphere - adiabatic expansion with rapid cooling. We calculate the time-dependent ionization state and obtain the resulting line emission. ~cs Loop Footpoint Energetic Beam Te(t) = 5 MK Ne(t) = 1012 cm-3 Δt~ 1 sec B Chromosphere Chromosphere Te(0) = 12 MK Ne(0) = 4 x 1012 cm-3