Download
1 / 11
110 likes | 241 Views
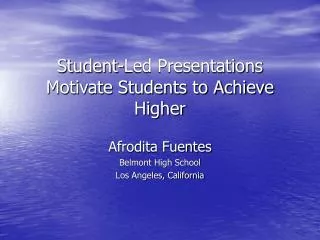
Student-Led Presentations Motivate Students to Achieve Higher . Afrodita Fuentes Belmont High School Los Angeles, California . Data Collection Tools. Motivation & Achievement Pre-survey & Post-survey Rating Scale Student-Led Presentations Scores Final Grade/percentage Teacher Notes.

E N D
Student-Led Presentations Motivate Students to Achieve Higher Afrodita Fuentes Belmont High School Los Angeles, California
Data Collection Tools Motivation & Achievement • Pre-survey & Post-survey • Rating Scale • Student-Led Presentations Scores • Final Grade/percentage • Teacher Notes
Student-Led Presentations rating scale towards end • Motivate for better Grade 44% agree, 38% not sure • Help understand biology 47% agreed, 38% not sure • Recommended by students 60% agree, 29% not sure Less than 13% disagree in all three
Value of student-led presentations rating scale towards end • Controversy: Most students said they valued the presenters, but very few presenters felt valued by the audience • Of the presenters, 42% gave not opinion & 36% disagreed on feeling valued. • 58% of the students felt valued by the teacher when they presented, 33% gave no opinion, & 7% did not feel valued
The percentage of students who considered themselves good presenters Sometimes - increased from 15% to 40% Never – decreased from 28% to 17%
Help learn and understand the material Learn from each other Share what we learn Too nervous, shy, can’t speak People not t being ready Boring Like vs. Dislike presentations
Interests me Listen to others discuss & share ideas Teacher explains People distract me I don’t pay attention LEARN more vs. LEARN less