Forecasting Dependency Population Trends: 2000-2050 Analysis
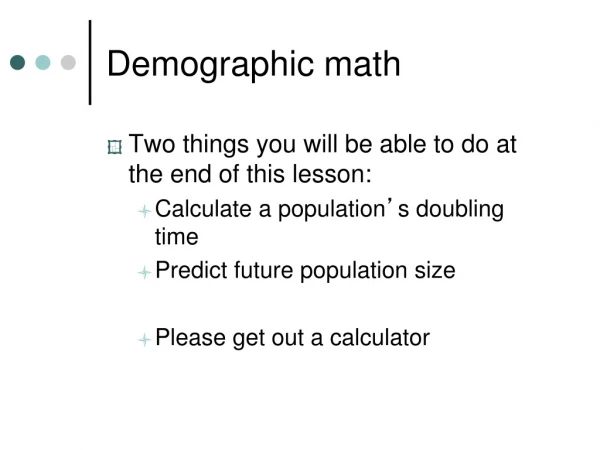
This study delves into the demographic shifts of a population of 34 million, with an annual growth rate between 0.91% and 1.21% from 2000 to 2010. In 2010, the youth population (under 15) was 16.5% and the elderly population (65 and over) was 14.1%. By 2050, the elderly population is projected to reach 25% of the total population, indicating a significant shift in dependency trends over time. Data source: OECDStat (2012).


Forecasting Dependency Population Trends: 2000-2050 Analysis
E N D
Presentation Transcript
Demographics •Totalpopulation:34million •Annualpopulationgrowthrates:between0.91%and1.21%2000- 2010 •Dependencypopulation2010 –Youthpopulation(agedlessthan15):16.5% –Elderlypopulation(aged65andover):14.1% •Dependencypopulationaged65andovergrowingrapidly: predictedtoreach25%oftotalpopulationby2050 8
DependencyPopulation,TrendandForecast,2000-2050 30 25 YouthPopulation(aged lessthan15)%oftotal Population Elderlypopulation(aged 65andover)%oftotal Population 20 15 10 5 0 Source:OECDStat(2012) 2000 2005 2010 2020 2030 2040 2050 9