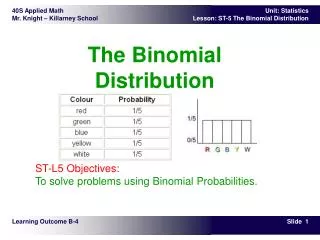
Data Analysis Lecture 4: Binomial Distribution
Data Analysis Lecture 4: Binomial Distribution. Outline. How to determine if a probability experiment is a binomial experiment How to find binomial probabilities How to construct a binomial distribution and its graph

Data Analysis Lecture 4: Binomial Distribution
E N D
Presentation Transcript
University Of Malakand | Department of Computer Science | UoMIPS| Dr. Engr. Sami ur Rahman | 2 Outline • How to determine if a probability experiment is a binomial experiment • How to find binomial probabilities • How to construct a binomial distribution and its graph • How to find the mean, variance and standard deviation of a binomial probability distribution
Binomial Experiments • Probability experiments for which the results of each trial can be reduced to two outcomes: success and failure. • Example • Flipping the coin University Of Malakand | Department of Computer Science | UoMIPS| Dr. Engr. Sami ur Rahman | 3
Binomial Experiments • Suppose we flip a coin 2 times • Possible outcomes • H H • H T • T H • T T • Sample space shows 4 possible outcomes or sequences. • There are 2 ways to get a total of one heads (HT and TH). These are combinations. Order does NOT matter. University Of Malakand | Department of Computer Science | UoMIPS| Dr. Engr. Sami ur Rahman | 4
Definition • A binomial experiment is a probability experiment that satisfies the following conditions: • The experiment is repeated for a fixed number of trials, where each trial is independent of the other trials. • There are only two possible outcomes of interest for each trial. The outcomes can be classified as a success (S) or as a failure (F). • The probability of a success, P(S), is the same for each trial. • The random variable, x, counts the number of successful trials. University Of Malakand | Department of Computer Science | UoMIPS| Dr. Engr. Sami ur Rahman | 5
Flipping a coin • You flip a coin 2 times and count the number of times the coin lands on heads. This a binomial experiment because • The experiment consists of repeated trials. We flip a coin 2 times. • * Each trial can result in just two possible outcomes - heads or tails. • * The probability of success is constant - 0.5 on every trial. • * The trials are independent; that is, getting heads on one trial does not affect whether we get heads on other trials. University Of Malakand | Department of Computer Science | UoMIPS| Dr. Engr. Sami ur Rahman | 6
Flipping a coin • HH, HT, TH, TT • Suppose our interest is Heads. If the coin is fair, p(Heads) = .5; q = 1-p = .5. • The probability of any permutation for 2 trials is ¼ = p*p, or p*q, or q*p, or q*q. All permutations are equally probable. • The probability of 1 head in any order is 2/4 = .5 = HT+TH/(HH+HT+TH+TT) University Of Malakand | Department of Computer Science | UoMIPS| Dr. Engr. Sami ur Rahman | 8
Know where to apply Binomial Distribution? B(n,p) n = number of observation P = probability of success The most important skill for using binomial distribution is the ability to recognize situations to which they do and don’t apply University Of Malakand | Department of Computer Science | UoMIPS| Dr. Engr. Sami ur Rahman | 9
What we are interested in? Suppose we flip a coin two times and count the number of heads (successes). The binomial random variable is the number of heads, which can take on values of 0, 1, or 2. The binomial distribution is presented below. University Of Malakand | Department of Computer Science | UoMIPS| Dr. Engr. Sami ur Rahman | 10
Example: Binomial Experiments • Decide whether the experiment is a binomial experiment. If it is, specify the values of n, p and q and list the possible values of the random variable, x. If it is not, explain why. A certain surgical procedure has an 85% chance of success. A doctor performs the procedure on eight patients. The random variable represents the number of successful surgeries. University Of Malakand | Department of Computer Science | UoMIPS| Dr. Engr. Sami ur Rahman | 11
Ex. 1: Binomial Experiments the experiment is a binomial experiment because it satisfies the four conditions of a binomial experiment. 1. Each surgery represents one trial. 2. There are eight surgeries, and each surgery is independent of the others. 3. There are only two possible outcomes for each surgery—either the surgery is a success or it is a failure. Finally, 4. The probability of success for each surgery is 0.85. n = 8 p = 0.85 q = 1 – 0.85 = 0.15 x = 0, 1, 2, 3, 4, 5, 6, 7, 8 University Of Malakand | Department of Computer Science | UoMIPS| Dr. Engr. Sami ur Rahman | 12
Population Parameters of a Binomial Distribution n = 2 p = .5 μx =n(p) = 1 Mean: Variance: 2 =n(p)( 1 - p ) = .5 σ2x = √n(p)( 1 - P ) = .71 σx Standard Deviation: University Of Malakand | Department of Computer Science | UoMIPS| Dr. Engr. Sami ur Rahman | 13
How to Find Binomial Probabilities In a binomial experiment, the probability of exactly x successes in n trials is: University Of Malakand | Department of Computer Science | UoMIPS| Dr. Engr. Sami ur Rahman | 14
Graph of Binomial Distribution • When p is .5, as N increases, the binomial approximates the Normal. University Of Malakand | Department of Computer Science | UoMIPS| Dr. Engr. Sami ur Rahman | 15
University Of Malakand | Department of Computer Science | UoMIPS| Dr. Engr. Sami ur Rahman | 16 Thanks for your attention
University Of Malakand | Department of Computer Science | UoMIPS| Dr. Engr. Sami ur Rahman | 17 Variable: minutes studied on a typical weeknight of a first-year university class Random samples of 30 women and 30 men: Women:180,120,150, 200, 120,90,120,180,120, 150, 60, 240,180,120,180,180,120, 180, 360, 240, 180, 150, 180, 115,240, 170, 150,180,180,120 Men: 90, 90,150,240,30,0, 120,45,120,60,230,200,30,30, 60, 120, 120, 120, 90, 120, 240, 60, 95, 120,200,75,300, 30, 150,180 Example-Do women study more than men?
University Of Malakand | Department of Computer Science | UoMIPS| Dr. Engr. Sami ur Rahman | 18 No of students complete MS studies University No of Adm. No. of Successful students Uni 1 20 12 Uni 2 40 18 Uni3 12 10 Uni 4 25 22 Uni 5 20 17 Uni 6 40 27 Uni7 12 10 Uni8 25 22 Uni 9 20 13 Uni 10 40 26 Uni11 12 10 Uni12 25 22