Download

1 / 23
230 likes | 429 Views
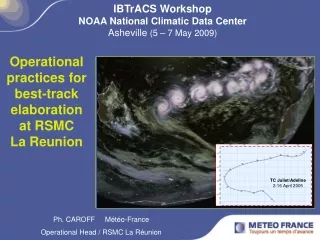
IBTrACS Workshop NOAA National Climatic Data Center Asheville (5 – 7 May 2009). Operational practices for best-track elaboration at RSMC La Reunion. Ph. CAROFF Météo-France Operational Head / RSMC La Réunion. TC Juliet/Adeline 2-16 April 2005. " Fused "

E N D
IBTrACS Workshop NOAA National Climatic Data Center Asheville (5 – 7 May 2009) Operational practices for best-track elaboration at RSMC La Reunion Ph. CAROFF Météo-France Operational Head / RSMC La Réunion TC Juliet/Adeline 2-16 April 2005
"Fused" Satellite-Based TC Intensity and Size Estimates AMSU TC analysis : an integrated process DVORAK manual ADT Human expertise and (expert system) 1st GUESS scatterometer data (for wind radii and max winds up to 50 kt) MICROWAVE
TC analysis : an integrated process Wind Radii Dvorak Manual 1st Guess T, CI Microwave imagery Scatterometer data Schematic diagram of the TC analysis process at RSMC La Réunion. 2nd Guess T, CI AMSU derived Intensity ADT Adjusted CI Application of Wind and MSLPcorrespondences Final Max Wind and MSLP Max Wind MSLP Surface Observations (buoys, …)
TC analysis : an integrated process Wind Radii Dvorak Manual 1st Guess T, CI Microwave imagery Scatterometer data Schematic diagram of the TC analysis process at RSMC La Réunion. 2nd Guess T, CI AMSU derived Intensity ADT Adjusted CI Application of Wind and MSLPcorrespondences Each step mostly relies on human expertise (subjectivity) and/or tools with uncertainties and limitations that are all liable to introduce errors/uncertainties in the process and results. Final Max Wind and MSLP Max Wind MSLP Surface Observations (buoys, …)
TC analysis : specific cases Météosat 5 19/02/2006 0530 UTC
TC analysis : specific cases Météosat 5 03/03/2006 0600 UTC
The pressure-winds relationship(s) issue Dvorak Scale for the South-West Indian Ocean (last modified in Sept 1999) Has never been really validated
CI Dvorak 10 min Max Wind (1 min) Peak gust MSLP (hPa) 10 min Max Wind (1 min) Peak gust MSLP (hPa) 10 min Max Wind (1 min) Peak gust MSLP (hPa) 1.0 20 (25) 31 1010 20 (25) 30 22 (25) 31 1.5 20 (25) 31 1007 20 (25) 30 22(25) 31 2.0 24 (30) 37 1004 24 (30) 36 1000 26 (30) 37 1000 2.5 28 (35) 43 1000 28 (35) 42 997 31 (35) 43 997 3.0 32 (40) 50 995 36 (45) 54 991 40 (45) 56 991 3.5 40 (50) 62 990 44 (55) 66 984 48 (55) 68 984 4.0 48 (60) 75 985 52 (65) 78 976 57 (65) 80 976 4.5 58 (72) 90 976 62 (77) 93 966 68 (77) 96 966 5.0 68 (85) 105 967 72 (90) 108 954 79 (90) 112 954 5.5 78 (97) 121 957 82(102) 123 941 90(102) 127 941 6.0 88 (110) 137 945 92 (115) 138 927 101(115) 143 927 6.5 98 (122) 152 931 102 (127) 153 914 112(127) 158 914 7.0 108 (135) 168 917 112 (140) 168 898 123 (140) 174 898 7.5 120 (150) 187 903 124 (155) 186 879 136(155) 192 879 8.0 136 (170) 209 888 136 (170) 204 858 150 (170) 211 858 Conversion factor of 0.8 on MSW gust factor of 1.55 or 1.25 Average of ATL and NWP scales Conversion factor of 0.8 on MSW gust factor of 1.5 NWP scale (Shewchuck and Weir) Conversion factor of 0.88 on MSW gust factor of 1.41 Not modified (NWP scale) Period From 1977-1978 to 1984-1985 From 1985-1986 to 1998-1999 From season 1999-2000 Origin Events having had an impact on tropical cyclone monitoring and best-track elaboration at RSMC La Réunion: the main milestones Table 1 : Dvorak intensities and associated pressure-winds relationships at La Réunion’s Centre.
The satellite data issue : a specific caveat to TC monitoring in the South-West Indian Ocean Permanent geostationary satellite coverage of the southern IO really recent (May 1998).
The satellite data issue : a specific caveat to TC monitoring in the South-West Indian Ocean resolution of the imagery is only 106 km at 55E
The satellite data issue : a specific caveat to TC monitoring in the South-West Indian Ocean
The satellite data issue : a specific caveat to TC monitoring in the South-West Indian Ocean
The satellite data issue : a specific caveat to TC monitoring in the South-West Indian Ocean The polar-orbiting satellites scope of acquisition from La Reunion does not cover the whole Area of Responsibility. Eq 90E Scope of acquisition for polar-orbiting satellites La Réunion Island 30E 40S La Réunion RSMC’s AoR Satellite swath
The satellite data issue : a specific caveat to TC monitoring in the South-West Indian Ocean Prior to 1998 (geostationary era) there was hence a great lack of satellite data on the eastern portion of the AoR. Eq 90E Scope of acquisition for polar-orbiting satellites La Réunion Island 30E 40S La Réunion RSMC’s AoR Satellite swath
The satellite data issue : a specific caveat to TC monitoring in the South-West Indian Ocean First satellite images received in 1965, but real beginning "satellite era" can be dated in 1967 with regular acquisition of first polar-orbiting satellites of the NIMBUS, ESSA (the long lasting ESSA 8 being the most prominent satellite since operating for more some 8 years – providing a single daily morning image from 1968 to early 1976), and TIROS (NOAA) series, via an A.P.T. (Automatic Pictures Transmissions) receiving station (paper, not digital). Occasional reception of the Russian satellites METEOR during the 1980’s. Sampling very irregular and often limited : most of the time two to three satellites received (which meant a maximum of 6 daily orbits on each tropical system), but frequently only one prior to 1975 (and even occasionally later on, like during the height of cyclone season 1979-1980, when NOAA 7 was absent for about one month after 20 January 1980 leaving the Center with NOAA 6 solely). No permanent geostationary satellite coverage of the whole Area of Responsibility before May 1998, except for most of the 1978-1979 cyclone season with the temporary displacement (on 1st December 1978) of GOES I.O. at 58°E (for the 1st GARP Global Experiment – including MONEX) : images received at La Reunion from January to November 1979. But partial coverage since the end of the 1970’s of the western part of the basin by Meteosat satellites (say west of 70/75E but with fast degradation east of 60E – strong deformation and poor resolution of the imagery – only 106 km at 55E) since the early 1980’s (Meteosat 2 received end of 1981, Meteosat 1 temporarily received in 1978-1979). 3 hrly low resolution imagery; no digital imagery prior to 1991; PDUS station acquired end of 1996 enabling ½ hourly reception of high resolution imagery. and of the eastern part of the basin by GMS (and then MTSAT) Japanese satellites (say east of 70E but with increasing degradation west of 80E) : WEFAX imagery of poor resolution. 3 hrly imagery; no digital imagery prior to the early 1990’s. Increased frequency and quality since 1996.
Events having had an impact on tropical cyclone monitoring and best-track elaboration at RSMC La Réunion: the main milestones 11 January 1848 : date of the first cyclone-related data in La Réunion’s Centre database. January 1960 : beginning of "naming era" (first named system TC ALEX). Shift in the database from daily data (only one TC location provided per day – at 06Z) to 6hrly data (with addition of the storm type). 1967 : real beginning of "satellite era". But first nighttime images probably acquired only from cyclone season 1972-1973 (with NOAA 2) but with lot of trouble to navigate the images prior to 1975 (or 1976?). End of 1968 : Starting using the works from the NESC (U.S. National Environmental Satellite Center), with first attempts of categorizing storms by "intensities" assessed from satellite patterns (derived from the Vincent J. Oliver Classification, which was thereafter used until 1981). Mid-1981 : Dvorak Technique definitively adopted. But had already been used as the main TC analysis technique during cyclone seasons 1977-1978 and 1978-1979. September 1985 : Dvorak intensities and related pressure-wind relationships modified : application of a 0.8 conversion factor to derive Maximum 10-min average winds from Maximum sustained winds. Area of Responsibility extended from 80°E to 90°E : quite a significant increase in areal coverage of the domain and, as a direct result, of the volume of best-track data (but with no upgrade of the satellite coverage, remaining very insufficient to monitor this new eastern portion of the AoR… lots of uncertain data for this part of the basin – especially east of 80E). November 1990 : beginning of "digital imagery era", with the implementation of an HRPT station for the NOAA satellites reception. December 1992 : beginning of scatterometer era. First scattoremeter data received from ERS 1 (followed by ERS2 and then QuikScat – since season 1999-2000 – and Ascat since July 2007).
Events having had an impact on tropical cyclone monitoring and best-track elaboration at RSMC La Réunion: the main milestones 1st July 1993 : Meteo-France at La Réunion officially designated as the WMO RSMC/Tropical Cyclones for the South-West Indian Ocean. Marginalimpact on best-tracks since the Center has already started operating like an RSMC since 1988 (when it was recognized as a Regional Tropical Cyclones Advisory Centre). Some parameters added in the database : RMW (Radius of Maximum Wind), DOCI (Diameter of Outermost Closed Isobar), 30 kt wind radii. December 1995 : PDUS station acquired. May 1998 : beginning of "geostationary era", with the "permanent" coverage of the basin (following the displacement of Meteosat 5 to 63°E for the INDOEX Experiment, replaced by Meteosat 7 by the end of 2006 at 67°E). Major increase in spatial (best-track data extending thereafter more eastward – 99.9E being the eastern limit – and southward) and temporal sampling (1/2 hrly imagery) of the storms. September 1999 : Pressure-Wind Relationship modified : application of a 0.88 conversion factor to derive Maximum 10-min average winds from Maximum sustained winds. Gust factor also modified. Main accruing changes : shift towards stronger intensities for the same Dvorak intensity (CI 4.5 now associated with hurricane force winds); for the same maximum winds MSLP now lowered; standardization of procedures with other southern hemisphere Centers. 1999 : beginning of "Internet era" at the RSMC. Access to specialized websites and to their near real-time data. A major revolution in TC monitoring and in our operational practices. Access to microwave data and to more scatterometer data. 2002 : cyclone seasons now considered to start on 1st July (instead of 1st August). September 2003 : Application of the new WMO best-track format. Addition of new parameters in the database : peak gust, 50 kt wind radii, plus quality codes. RSMC’s Area of Responsibility enlarged from the Equator to 40°S (instead of 5°S to 30°S). Some impact on operations but no real impact on best-tracks (since the systems were already best-tracked for their entire life-cycle). 2005 : acquisition of MSG imagery. Increased frequency of imagery on the western part of the basin (every 15 min) with new channels and increased resolution (High Resolution Visible in particular).
Best-track elaboration at RSMC La Réunion The "final" best-track elaboration can be described as a three steps process : 1) An "analysis database" is constructed from real time to near-real time satellite (or radar) data from all origins acquired : it contains TC analyses at random hours with one point every 4 (to 6) hours in average. Short-term track oscillations (like trochoïdal motion) are generally smoothed. 2) This "analysis database" is subject to corrections made in near-real time (generally within 24 hours) in order to generate an "operational best-track" database with 6 hourly positions generated by interpolating the data from the "analysis database" : at this stage most corrections concern LLCC locations. 3) Additional post-storm re-analysis and corrections are made within 1 to 6 months after the end of the storm’s life-cycle to finalize the "final" best-track : little impact on LLCC locations, but greater impact on intensities and even more for other parameters (wind radii, RMW, etc…). The internal policy is since a decade to keep in the final best-track database only the significant storms, i.e. the one which have been analysed as tropical depression (10-min average Max Winds of near-gale force) for at least 24 hours. This was not the case in the past. In the database we can find many systems – even named – that were weak systems, some of them not even now considered as tropical depressions (even in the satellite era – in the 1960s and 1970s mostly).
Periods Jan 1848 - 1960 Nov 1960 - 1977 Nov 1977 - 1993 Nov 1993 – 2003 Since Nov 2003 Number of systems 738 185 TC name Numerical Alphanumerical (Naming era) Date X X X X X LLCC Lat/Lon X 06Z daily locations (5203) X 6hrly (1504) X 6hrly () X 6hrly () X 6hrly () Storm Type No X X X X Dvorak Intens. No No X(1) X X Max Wind No No X(2) X(4) X MSLP No No X(3) X(4) X LLCC Confidence No No No X X RMW No No No X X DOCI No No No X X 30 kt Wind Radii No No No X X 50 kt Wind Radii No No No No X Peak gust No No No No X The RSMC La Réunionbest-track database : Table 2 : Distribution of main parameters within La Réunion’s cyclone database
Best-track revision at RSMC La Réunion: the prospects • Engaged to revise our past best-track data by : • 1) re-analyzing all relevant past imagery • Focussing on the satellite period prior to 1998 and with special emphasis on the systems having evolved in the eastern part of the basin. • First step engaged with ongoing link with the HURSAT project to get access to past imagery (mostly interested in AVHRR imagery of polar orbiting satellites). 2) move towards the unified pressure-winds relationship proposed by Knaff and Zehr. • The process of testing the K/Z PWR against MSLP and Max winds observations in the SWIO basin has started.
Towards a global (?) re-analysis of tropical cyclone best-track databases ORISSA 28/10/1999 Meteosat 5 15Z TC 01-A 24/05/2001 Meteosat 5 06Z TIP 12/10/1979 NOAA 5 0456Z MONICA 23/04/12006 MTSAT 1 03Z ZOE 27/12/2002 NOAA 15 1847Z GAFILO 06/03/2004 NOAA 16 1045Z FREDERIC/EVRINA 31/03/1999 09Z Meteosat 5 VANCE 21/03/1999 GMS 5 21Z
Towards a global (?) re-analysis of tropical cyclone best-track databases ORISSA 28/10/1999 Meteosat 5 15Z TC 01-A 24/05/2001 Meteosat 5 06Z TIP 12/10/1979 NOAA 5 0456Z MONICA 23/04/12006 MTSAT 1 03Z ZOE 27/12/2002 NOAA 15 1847Z GAFILO 06/03/2004 NOAA 16 1045Z FREDERIC/EVRINA 31/03/1999 09Z Meteosat 5 VANCE 21/03/1999 GMS 5 21Z Re-analysis project at RSMC La Reunion : 1st step : collect past satellite imagery from the HURSAT database under construction.