Download
1 / 1
10 likes | 158 Views
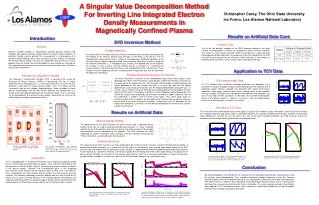
A Singular Value Decomposition Method For Inverting Line Integrated Electron Density Measurements in Magnetically Confined Plasma. Results on Artificial Data Cont. Introduction. Application to TCV Data. Inversion Time.

E N D
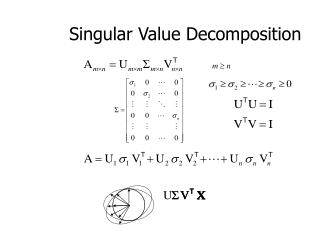
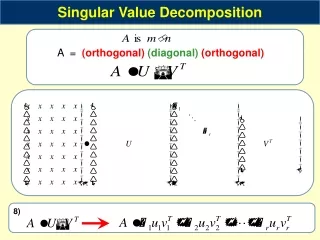
A Singular Value Decomposition Method For Inverting Line Integrated Electron Density Measurements in Magnetically Confined Plasma Results on Artificial Data Cont. Introduction Application to TCV Data Inversion Time Electron transport studies in magnetically confined plasmas require high temporal and spatial resolution measurements of electron density profiles. A common method used to perform this measurement is interferometry of a coherent electromagnetic wave across the plasma cross section. To calculate the electron density profile from this line integrated measurement an inverse problem must be solved. We have developed a novel method for inverting the line integrated interferometric measurement using information from a Thomson scattering measurements. One of the the greatest strengths of the SVD inversion method is the small number of computations it requires as compared to other inversion methods. This results in a much faster inversion, which can be done for a whole tokamak discharge during data acquisition. A comparison of the time required for the SVD inversion to that required for the minimum Fisher inversion, as the number of temporal points inverted is varied, can be seen in the table to the right. Abstract Results on Artificial Data SVD Inversion Method Tokamak à Configuration Variable The Tokamak à Configuration Variable (TCV) is housed at the Center for Research of Plasma Physics (CRPP) in Switzerland. Due to its unique geometry with an elongation of 3, i.e. three times taller than it is wide, TCV can produce a wide array of unique plasma shapes. Thus, TCV allows for the systematic study of very strongly shaped plasmas. Some examples of these plasma configurations can be seen below. Because the performance of a fusion reactor will depend significantly on the plasma shape, TCV is a vital tool for the development of a practical fusion reactor, allowing for the study of the effect of plasma shape on confinement times. TCV Interferometer Data On TCV, different types of central relaxation oscillations are observed in the presence of electron cyclotron heating (ECH) depending on the location of the deposition power. Normal sawteeth are observed with central ECH power deposition, while giant sawteeth occur when heating close to the sawtooth inversion surface. Examples of line integrated interferometer measurements can be seen for both of these oscillations to the right. The seventh interferometer chord, at the plasma center, is shown in (a) and (c). The first interferometer chord, at the plasma edge, is shown in (b) and (d). Standard Sawteeth Giant Sawteeth 1.3 1.4 (a) (c) 1.25 1.35 ne [m-2 10-19] 1.2 1.3 1.15 1.25 1.1 1.2 1.05 1.15 1 1.1 0.7 0.71 0.72 0.73 0.74 0.68 0.69 0.7 0.71 0.72 4.2 (b) (d) 3.6 4 3.4 3.8 ne [m-2 10-19] 3.2 3.6 3 2.8 3 3.4 2.8 2.6 2.8 3.2 2.6 3 2.4 2.6 Inversion of TCV Data 2.4 2.8 2.2 2.4 0.7 0.71 0.72 0.73 0.74 0.68 0.69 0.7 0.71 0.72 t [s] t [s] 2 2.2 The inversion of the interferometer data shown above, using the SVD method, can be seen below. The SVD inversion reveals the sawtooth oscillation and clearly shows a difference between the standard sawteeth and the giant sawteeth. Furthermore, when plotted as a function of ρ we see that in the case of the giant sawtooth oscillation, the SVD inversion reveals the hollowness of the electron density profile after the sawtooth crash. 1.8 2 1.6 1.8 1.4 1.6 0.7 0.71 0.72 0.73 0.74 0.68 0.69 0.7 0.71 0.72 Artificial Density Profiles 1.8 1.9 The performance of the SVD inversion has been tested using a phantom density profile, which can be used to calculate pseudo-measurements, i.e. what a detector would measure if the phantom were the true density. The reconstruction of the pseudo-measurements can be compared to the phantom. The SVD inversion has been compared to another commonly used statistical inversion method, minimizing the Fisher information, using the phantom density profile. 1.7 1.8 1.6 1.7 1.5 1.6 Standard Sawteeth Giant Sawteeth Standard Sawteeth Giant Sawteeth 1.4 1.5 0.7 0.71 0.72 0.73 0.74 0.68 0.69 0.7 0.71 0.72 3 3 (a) (c) ne [m-3 10-19] Inversion Accuracy 2.5 2.5 The accuracy of the SVD inversion has been compared to the minimum Fisher inversion using the phantom density profile. A comparison of both inversions as a function of the flux radius at two different times can be seen below. Because the SVD inversion does not impose artificial constraints on the solution, as opposed to the artificial smoothing imposed by minimizing the Fisher information, it preserves features in the density profile that minimizing the Fisher information destroys. A comparison of both inversion methods as a function of time can be seen below as well. The χ2 has been calculated in ρ space at each time sample for both methods. It is clear in this plot that the SVD inversion produces less cumulative error. 2 2 ne [m-3 10-19] TCV has an elongation of 3, allowing for the formation of very strongly shaped plasmas Far infrared interferometer and Thomson scattering on TCV. The lines represent the 14 laser beams probing the plasma and the red boxes show the 25 scattering volumes. (b) (d) 1.5 1.5 ne [m-3 10-19] 1 1 Inversion using the SVD of TCV interferometer data as a function of time for different radial positions: (a) and (c) on axis, (b) and (d) outside of the inversion radius at ρ = 0.8. Inversion using the SVD of TCV interferometer data as a function of ρ for the times marked in the figure to the left. (a) Min. Fisher Information SVD Inversion 0.5 0.5 0 0.2 0.4 0.6 0.8 1 0 0.2 0.4 0.6 0.8 1 t [s] t [s] ρ ρ Density (b) Density Density Conclusion (c) χ2 We have developed a new method for the inversion of line integrated interferometer measurements using the singular value decomposition. This method is particularly powerful because it uses the Thomson scattering data to invert the interferometric data; thus, coupling the information from these two diagnostics. The SVD inversion is effective when applied to simulated electron density profiles, and is more accurate and faster than inversion by minimizing the Fisher information. This novel inversion method is also effective when applied to TCV interferometer data, and is capable of revealing the hollowness of density profiles which previous methods would have destroyed. ρ ρ t / sawtooth period Inverted electron densities at (a) ρ = 0 and (b) ρ = 0.625. Error of inversion methods in ρ space is shown in (c) as a function of time. Time evolution of the actual electron density is shown as a dashed red line, SVD inversion is shown in blue, and minimum Fisher inversion is shown in magenta. Inversion of artificial electron density as a function of ρ. Actual density profile is shown as dashed red lines and inversions as solid blue lines. Christopher Carey, The Ohio State University Ivo Furno, Los Alamos National Laboratory Problem Definition As can be seen on the right, the phase shift of an interferometer chord can be related to the line integral of the electron density along the path of the beam in the plasma. The 14 interferometer measurements form a system of inhomogeneous Fredholm equations of the first kind, which is always underdetermined. One method for solving this system is to expand the unknown parameter, ne, in orthogonal basis functions that depend only on the magnetic flux surface, ρ. This assumes that the electron density is constant on a magnetic flux surface, which is valid in the case that there is not strong MHD activity in the plasma. These functions are line integrated, and the resulting system of equations can then be solved for the expansion coefficients. Singular Value Decomposition for Inversion Our novel method for inversion of the interferometer data utilizes the singular value decomposition (SVD) of the Thompson scattering data to determine the basis functions for the expansion of the electron density. The Thomson scattering data has both temporal and spatial dependence. We can arrange this data in a matrix Ne such that the spatial dependence is stored along the columns and the temporal dependence along the rows, as can be seen on the left. Using the SVD, Ne can be decomposed into the product of three matrices; U, S, and V. The columns of U form a set of orthogonal spatial eigenmodes that contain the spatial information of Ne and are often referred to as topos. Moreover, most of this information is stored in the first three to four topos. Thus, these topos make an excellent choice of basis functions for the expansion of the local electron density. Because we are able to use only a few basis functions, solving the set of 14 equations for the expansion coefficients, ai, becomes an over determined problem for which a least squares solution can be found. Diagnostics TCV is equipped with a 14 chord interferometer and a Thomson scattering system for the measurement of electron density profiles. Data from the interferometer can be acquired at a rate of 25 kHz, which is fast enough to resolve features of interest in the density profiles. However, the interferometer gives a line integrated measurement of the electron density along the path of each laser in the plasma. Thus, to determine the local electron density profiles this measurement must be inverted. The Thomson scattering system can acquire data at a rate of up to 20 Hz, which is far to slow to resolve features in the electron density. Nevertheless, the Thomson scattering system has the advantage of giving a local measurement of the electron density at 25 positions along a vertical line in the plasma cross section.