Download
1 / 3
30 likes | 125 Views
Explore the demographic breakdown of the 113th Congress, including numbers of Republicans, Democrats, women, African-American, Asian-American, Hispanic, and religious affiliations. Discover key statistics on wealth and welfare in the 112th Congress.

E N D
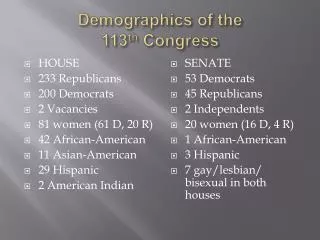
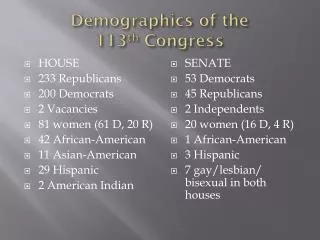
Demographics of the 113th Congress • HOUSE • 233 Republicans • 200 Democrats • 2 Vacancies • 81 women (61 D, 20 R) • 42 African-American • 11 Asian-American • 29 Hispanic • 2 American Indian • SENATE • 53 Democrats • 45 Republicans • 2 Independents • 20 women (16 D, 4 R) • 1 African-American • 3 Hispanic • 7 gay/lesbian/ bisexual in both houses
Demographics of the 113th Congress • HOUSE • 246 Protestant • 134 Catholic • 22 Jewish • 8 Unspecified • 5 Orthodox Christian • 2 Buddhist • 2 Moslem • 1 Unitarian Universalist • 1 Hindu • 1 Unspecified • SENATE • 53 Protestant • 27 Catholic • 10 Jewish • 7 Mormon • 2 Unspecified • 1 Buddhist
112th Congress • Members of Congress who are millionaires: 47% • Members of Congress who have ever been on welfare: 2