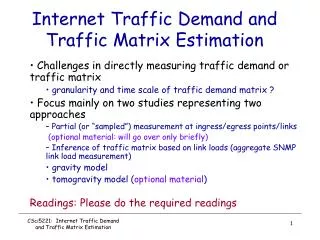
Download
1 / 13
130 likes | 347 Views
Trovus Benchmark Research – Mobile Traffic November 2012 Jaw-dropping benchmark figures on Mobile , iPad and D esktop browsing on B2B websites. They say mobile is taking over the desktop.

E N D
Trovus Benchmark Research – Mobile Traffic November 2012 Jaw-dropping benchmark figures on Mobile, iPadand Desktop browsing on B2B websites.
They say mobile is taking over the desktop.. Undisputedly, more and more people are using mobile devices (smartphones, iPads, tablets) to browse the internet.
But, is it true for B2B websites as well? • We have completed benchmark research by analysing B2B websites with an annual traffic of… • 20million hits… • …from industries such as legal, financial services, pharmaceutical, and manufacturing.
Finding 1 - Mobile vs. desktop traffic 5.8% of traffic is coming from mobile devices.
Finding 2 – The type of mobile/tablet traffic iPads and iPhones dominate the traffic with a total share of 75% of all mobile traffic.
Finding 3 – The revolution of iPad traffic Surge in the usage of iPads since the launch of the iPad 4 in 2012 (see graph below).
Finding 4 – The depth of engagement Almost equal number of pages are looked at through tablets than desktops.
Finding 4 – The depth of engagement • If you think about your own behaviour (and what the iPad was invented for), we do browse more on iPads given the circumstances we use the device in. • Unlike mobile phones (we tend to use them for practical information, such as maps and phone numbers). We use iPads to surf the internet and this shows up in the stats too.
Finding 5 – The days of engagement Saturdays & Sundays Even on corporate websites, the peak time activity from smartphones and iPads are on weekends!
Finding 6 – The hours of engagement ..and between 9-10 pm..
Final comment – Data spread Among all the B2B websites that we benchmarked, there were quite substantial differences in their statistics. Some of the websites had double the traffic than others from mobile devices! Whilst there might be various reasons for this, digital and overall marketing strategy does have an impact on how your customer reacts and the type of engagement you generate.
3things that you can do with this information • Compare yourself - let us compare your website against the benchmark. • Evaluate your digital content distribution strategy. • Build a business case - use benchmark figures to build a business case for digital communication investments.
For more information.. If you are keen to compare your performance or just need some advice on this topic, please talk to your Account Manager or Fanni Vig at fanni.vig@trovus.co.uk