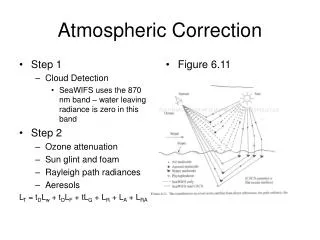
Understanding the Bonferroni Correction: Risks and Implications in Statistical Testing
220 likes | 362 Views
The Bonferroni correction is a statistical method aimed at mitigating the problem of multiple comparisons, which can lead to false associations. This presentation discusses its application and consequences, including the example of Joseph Rhine's paranormal studies that failed to confirm results under the correction. It highlights the risk of missing genuine findings due to Type II errors when using stringent significance levels. Meta-studies and new techniques like False Discovery Rate (FDR) control are explored as potential alternatives to preserve meaningful discoveries in genetic research.

Understanding the Bonferroni Correction: Risks and Implications in Statistical Testing
E N D
Presentation Transcript
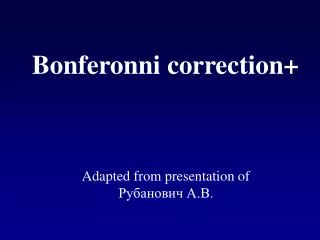
Bonferonni correction+ Adapted from presentation of Рубанович А.В.
1000 people guessed the sequence of 10 cards: red or black? 12 persons guessed 9 of 10 cards, two of them all 10 cards Experiments in finding people with paranormal powers: Joseph Rhine (1950) All these “physics” in further experiments did’t confirm their paranormal abilities
Problems of «multiple comparisons» ? • Genome-wide association: gene expression studies with DNA chips – 500 000 SNP. • For the significance level 0.01we can expect up to 5000 false associations • Meta-studies: joining and comparison of different results obtained by different authors Multiple testing is dangerous: large probability to find false association!
Significant! How it happens? Appearance of false associations Let us generate two identically distributed samples with 100 personswith20-locus genotypes Should be OR=1 Odd Ratio –w/o association OR=1 Cases Controls GeneSample 1Sample 2 OR p All 3 loci are Associated with a disease! 2 4 3 1
Carlo Bonferroni (1935): When applyingmindependent statistical test, only significant results are results with How to avoid false associations? Applyingmindependent statistical tests with significance level a, a probability of at least one false association should be 1-(1-a)m< 0.05
1 against 8 with equal size samples : Bonferroni correction kills the significance of certain results: Two mutations associated with the disease But adjusted by Bonferroni it should be: p < 0,05/2=0,025
case_mut1=matrix(1,8,1) case_non_mut1=matrix(0,92,1) control_mut1=matrix(1,1,1) control_non_mut1=matrix(0,99,1) data=rbind(case_mut1,case_non_mut1,control_mut1,control_non_mut1) res=rbind(matrix(1,100,1),matrix(0,100,1)) mylogit<- glm(as.formula(res~data), family=binomial(link="logit"), na.action=na.pass) exp(mylogit$coefficients[2]) summary(mylogit)[["coefficients"]][,"Pr(>|z|)"] case_mut1=matrix(1,15,1) case_non_mut1=matrix(0,85,1) control_mut1=matrix(1,5,1) control_non_mut1=matrix(0,95,1) data=rbind(case_mut1,case_non_mut1,control_mut1,control_non_mut1) res=rbind(matrix(1,100,1),matrix(0,100,1)) mylogit<- glm(as.formula(res~data), family=binomial(link="logit"), na.action=na.pass) exp(mylogit$coefficients[2]) summary(mylogit)[["coefficients"]][,"Pr(>|z|)"] Example to compute OR
Not significant! According to Bonferroni shoud be: Assessment of individual sensitivity to ionizing radiationand DNA repair efficiency in a healthy population F. Marcona, C. Andreoli, et al. Mut. Res., 541 (2003) Genotypes
Not significant! Bonferroni correction requests: High-Throughput Detection of GST Polymorphic Alleles in a Pediatric Cancer Population P. Barnette, R. Scholl, et al. Cancer Epidemiology, Biomarkers & PreventionVol. 13, 304–313, 2004 Control 13 genotypes OR=6,4 P=0,007 8 diseases Homozygocity in GST prevents cancer! OR=2,3 P=0,018
Bonferroni correction leads to very high probability to miss proper association! Bonferroni method creates more problems thanit solves (Thomas Perneger, 1998): “Bonferroni adjustments are, at best, unnecessary and, at worst, deleterious to sound statistical inference…”
Errors by statistical testing … and is not taking care about the possibility to miss discovery (Type II Error) Null hypothesis – usually about absence of differences in two samples Traditionally a biologist is trying to avoid Type I error, i.e. to guarantee avoidance of False discoveries Type I Error Probability to reject null hypothesis=probability to find differences where there are any = Probability of false discovery TypeII Error Probability to accept wrong null hypothesis = Probability not to find existing differences = Probability to miss proper discovery Test power = 1- TypeII error = Probability to reject correctly null hypothesis = Probability to make a discovery
1 Dependence of Type II erroron number of tests using the Bonferroni correction Probability to miss gene with OR=2.7 with sample sizes 100(case)and 100 (control) With 100 comparisons to guarantee avoidance of 1 false discovery, we miss 88% proper discoveries! For m=100 the probability of error is 0.88 With 5 comparisons we miss 50% of discoveries In single test a probability to miss the discovery is 0.2 Type II error Number of tests
>105 papers in New algorithm to test statistical hypothesis: FDR-control False Discovery Rate control: Benjamini, Hochberg (1995)) Probability of false discovery < Significance level TypeI Error< 0.05 Traditional principle is replaced by Average fractionof false discoveries< Significance level chosen
Algorithm of FDRcontrol(Benjamini, Hochberg, 1995) • Order tests according to p-value : p1< p2 < … < pm. • For FDR control onα level (e.g. 0.05), we find • Differences are assumed to be significant for j = 1, …, j*. • Forj > j* differences are assumed not to be significant Significance level required Order number of gene P-value for j-th test (gene) Total number of tests (genes)
Example: multiplecomparisonson 10 tests Order tests in ascending order of p-value Significant corrections after FDR control In first cell Bonferroni p-value Bonferonni correction leaves only first value In second two times larger Three times larger and so on …. Significant p-values without correction That’s it!!! For 6th test p-value is larger than FDR
Example: expression of3051 genesin leykomiaGolub T.R. Molecular classification of cancer: class discovery and class prediction by gene expression monitoring.// Science. 2001, v.286. Number of genes with this level of t-statistics t-statistics for the comparison of gene expression in healthy and ill patients t-test: 1045 genes, for which p<0.05 Bonferroni correction: 98 genes with p’<0.000016 FDR: 681 genes, for which FDR< 0.05