Understanding Hypotheses: From Inductive to Deductive Reasoning in Scientific Methodology
This comprehensive overview covers the crucial aspects of forming and testing hypotheses within the scientific method. It delineates the differences between inductive reasoning (moving from specific observations to general conclusions) and deductive reasoning (starting from general principles to predict specific outcomes). The role of null and alternative hypotheses is highlighted, along with practical examples, such as testing the effectiveness of aspirin on headaches. Insights into experimental design, critical literature review, and maintaining objectivity in hypothesis testing are also discussed, emphasizing the importance of flexibility in scientific investigation.

Understanding Hypotheses: From Inductive to Deductive Reasoning in Scientific Methodology
E N D
Presentation Transcript
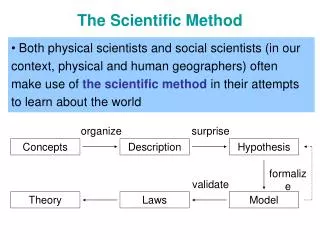
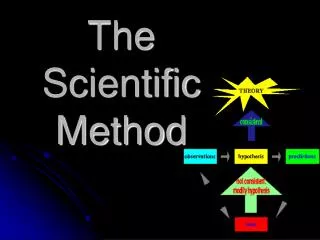
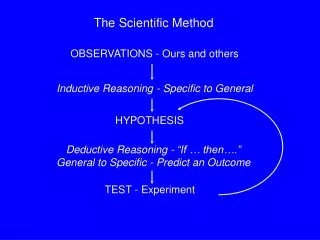
Inductive Reasoning - Specific to General HYPOTHESIS Deductive Reasoning - “If … then….” General to Specific - Predict an Outcome TEST - Experiment The Scientific Method OBSERVATIONS - Ours and others
How did you decide on a probable outcome? Observation of like/related occurrences Hypothesis - All beakers filled with water will spill their contents when inverted Null Hypothesis - Not all beakers will spill their contents when inverted
To be of value, hypotheses must be TESTABLE • “Aspirin relieves headaches” • “Aspirin relieves some headaches” • “Aspirin relieves all headaches if it is taken • within 0.5 h of the headache starting” • “Aspirin relieves 50% of all headaches within • 20 min.” • “Aspirin relieves significantly more headaches • within 30 min. than a placebo”
A hypothesis can not be proven to be true. One can only disprove a hypothesis: Hypothesis Conclusion/Prediction True True False True or False
The concept of accepting a hypothesis through the rejection of a “null” hypothesis is largely credited to Karl Popper. A null hypothesis is a statement about how the world would be if our conjecture is wrong. Difference in means – Observed is 3.8-7.7 = -3.9 Null is 7.7-7.0 = 0.7 Enough to reject the null hypothesis?
e.g. H1 - Aspirin relieves 50% of all headaches within 20 min. H0 – Aspirin has no effect on headaches within 20 min. • Take 10 people with headaches • Give them all aspirin • Five should experience relief within 20 min. If 5 do get relief, the hypothesis may be true, but it may be false! Do we reject the null hypothesis? These people might have lost their headaches anyway - The outcome could have been mere chance!
What about chance occurrences? How many times do we need to repeat our test? How can we satisfy ourselves that we’ve tested enough to eliminate chance “trues” when a hypothesis is really false? How sure do we like to be? A >95% level of assurance is generally accepted. Can we achieve such a level of assurance? It depends on our experimental design!
Let’s look at an example posed by Sir Ronald Fisher: A lady claims that by tasting a cup of tea with milk, she can determine whether the milk or the tea had been added first. How many cups of tea shall we test to see if she’s right? Let’s say 8 identical cups - 4 with tea added first, 4 with milk added first. The lady must divide the 8 cups into the correct two groups of 4.
There are 70 possible ways to divide the 8 cups into two groups of 4: (8x7x6x5)/(4x3x2x1) = 1680/24 = 70 Only oneof these is correct. The odds of making a correct decision by chance alone is: 1 in 70 or ~1.4% This is unlikely enough that we could accept her claim.
What if we had chosen to use only 6 cups: 3 with milk added first, 3 with tea added first? There would have been 20 possible outcomes: (6x5x4)/(3x2x1) = 120/6 = 20 The odds of making the correct choice by chance alone is: 1 in 20 or 5%. If we require being >95% sure, we can’t make a decision on the basis of this experiment!!!
How do you, as a beginning scientist, approach this process? • “… follow the scientific literature, but reading needs to be done with a critical, reflective attitude of mind if originality and freshness of outlook are not to be lost. Merely to accumulate information as a sort of capital investment is not sufficient. • The relevant literature is critically reviewed. • A thorough collections of field data or equivalent observational enquiry is conducted…. • The information is marshalled and correlated and the problem is defined and broken down into specific questions. • Intelligent guesses are made to answer the questions, as many hypotheses as possible being considered. • Experiments are devised to test the likeliest hypotheses bearing on the most crucial questions.” • (W.I.B. Beveridge. 1957. The Art of Scientific Investigation.)
“Hypothesis is the most important mental technique of the investigator, and its main function is to suggest new experiments or new observations. Indeed, most experiments and many observations are carried out with the deliberate object of testing an hypothesis. Another function is to help one see the significance of an object or event that otherwise would mean nothing.” (W.I.B. Beveridge. 1957. The Art of Scientific Investigation.)
“Precautions in the use of hypothesis • Not to cling to ideas proved useless. …We must be ready to abandon or modify our hypothesis as soon as it is shown to be inconsistent with the facts. This is not as easy as it sounds. • When delighted by the way one’s beautiful brain-child seems to explain otherwise incongruous facts and offers promise of further advances, it is tempting to overlook an observation that does not fit into the pattern woven, or to try to explain it away. • It is not at all rare for investigators to adhere to their broken hypotheses, turning a blind eye to contrary evidence….
Intellectual discipline of subordinating ideas to facts. A danger constantly to be guarded against is that as soon as one formulates an hypothesis, parental affection tends to influence observations, interpretation and judgment; ‘wishful thinking’ is likely to start unconsciously. • Claude Bernard said: • ‘Men who have excessive faith in their theories or ideas are not only ill-prepared for making discoveries; they also make poor observations.’
Examining ideas critically. One should not be too ready to embrace a conjecture that come into the mind; it must be submitted to most careful scrutiny before being accepted even as a tentative hypothesis, for once an opinion has been formed it is more difficult to think of alternatives.” (W.I.B. Beveridge. 1957. The Art of Scientific Investigation.)
“One of the first things which the beginner must grasp is that statistics need to be taken into account when the experiment is being planned, or else the results may not be worth treating statistically. Therefore biometrics is concerned not only with the interpretation of results but also with the planning of experiments…. It is not necessary for the biologist to become an expert in biometrics if he has no liking for the subject, but he ought to know enough about it to avoid either undue neglect or undue respect for it and to know when he should consult a biometrician…. The use of statistics does not lessen the necessity for using common sense in interpreting results, a point which is sometimes forgotten.” (W.I.B. Beveridge. 1957. The Art of Scientific Investigation.)
Experimental Design: • 1) Treatment groups selected for comparison • 2) Selection of experimental units: • Animals, field plots, Petri dishes, etc. • 3) Rules by which treatments are assigned to groups • 4) Types and modes of measurements/records • 5) Types of statistical tests to be applied to data These decisions must be made prior to embarking upon experimentation!
Sample size: All populations are finite, but many may be de facto infinite The need to increase sample size to accurately sample a population reaches a limiting value: Sampling Fraction (p) Ref. Pop. Size 10% 50% 90% 100% 1000 100 500 900 1000
Variance with a finite pop. = N and a sampling pop. = n: 1/n ((N-n)/(N-1)) for a base of 1000, variance = 1/1000p (1000-1000p)/999 = (1-p) / 999p where p= sampling fraction To get an equivalent variance for N = 10,000 as we got with a 90% sample of 1000: variance = (1-0.9) / (999 x 0.9) = 0.000111 for N = 10,000: 0.000111 = 1/n ((10,000 - n) / 9999) n= 4739
N Sampling Fraction (p) 10% 50% 90% 100% 1,000 100 500 900 1000 10,000 110 909 4435 10,000 100,000 111 990 8250 100,000 1,000,000 111 999 8911 1,000,000 Infinite 111 999 8911 Infinite
Experimental Design “Statistical analyses cannot upgrade poor design, but attention to statistical concepts during design can ensure that the major research goals can be attained at minimum cost.” T.A. Louis, 1983, Lab Animal 3:17-24. • Design Elements: • 1) Treatment groups selected for comparison • 2) Selection of experimental units: • Animals, field plots, Petri dishes, etc. • 3) Rules by which treatments are assigned to groups • 4) Types and modes of measurements/records • 5) Types of statistical tests to be applied to data
Some definitions: Experimental Unit – element or individual upon which some measurement is made (e.g. plot or rat). Item or Variate – individual observation or measurement taken on each experimental unit (e.g. # oysters/plot or wt. of rat). Character or Variable – property being measured (e.g. weight) Population – totality of items (variates) in a specified sampling area, limited in space and time, about which inferences are to be made. Treatment – classification or manipulation applied to experimental units. Factor – set of treatments of a single type.
Characteristics of Good Design: • Good estimation of treatment effects • Good estimation of random (individual) variation • Elimination of bias (to the extent possible) • Adequate precision and accuracy • Balance of efficiency and robustness • Balance of internal and external goals
To achieve estimation of treatment effects vs. individual variation, and elimination of bias: Controls – group with null level of treatment Randomization – random assignment of experimental units to treatment groups Replication – assigning more than one experimental unit to a treatment group
Controls – concurrent vs. longitudinal Generally concurrent is superior, but nested treatments may require longitudinal controls. Randomization – completely randomized, randomized blocks or systemic layouts (e.g. Latin square)
Replication vs. Subsampling vs. Pooled Items Objective: Measure the hemolymph osmolality of juveniles of two species of portunid crabs, C. sapidus and C. similis. Exp. Units: 8 individuals of C. sapidus, 8 individuals of C. similis. Protocol I: Take 10µl of hemolymph from each crab and read each in osmometer (10µl sample required). Average readings. Protocol II: Pool 10µl of hemolymph from 8 specimens of each species under mineral oil. Run 4 subsamples of each pooled hemolymph in osmometer. Protocol I: n= , df= Protocol II: n= , df= 16 14 2 1 What benefit is derived from replication? From subsampling?
Efficiency vs. Robustness Efficient designs and analyses optimize for a specific scientific question, but are sensitive to statistical and scientific assumptions. E.g. the comparison of two groups. Robust designs and analyses sacrifice efficiency for protection against departures from assumptions or changes in the question of major interest.
Internal vs. External Goals E.g. Should food in a rodent study be available ad libitum, or should the diet be restricted so as to control dose? Former is more relevant to rodent’s natural behavior, but latter permits a more precise dose group comparison. “You can learn either a lot about a few things or a little about many things; take your pick.”
E.g. Salinity preference of Uca minax Gradient Control
Salinity preference – circular design 0 5 35 10 30 15 25 20
Variables and Measurements • Continuous vs. Discontinuous (Discrete, Meristic, Ranked) • continuous – e.g. tail length, body weight • discrete – e.g. # of offspring, order of pupal emergence Most measurements of continuously distributed variables are approximate. Accuracy – how close the measurement is to the true value Precision – resolution of the measurement
Significant Digits Last digit reported should imply precision: 12.3 mm implies that the actual value is between 12.25 and 12.34 mm How many digits should we record? Rule of thumb: # of unit steps from smallest to largest measurement should be between 30 and 300. e.g. Measure shells to nearest 1mm. Smallest is 4mm, largest is 8mm. Only 4 steps – error of 1mm in last sig. digit = 25%. Measure to nearest 0.1mm. Smallest is 4.1mm, largest is 8.2 mm. Forty-one unit steps – error of 0.1mm <2.5%.
Caveat Regarding Derived Variables e.g. ratios 1.2/1.8 1.2 implies 1.15-1.24 1.8 implies 1.75-1.84 Ratio may be anywhere from: 1.15/1.84 to 1.24/1.75 or from 0.625 – 0.709 Max. error of original measurement = (1.24-1.2)/1.2 = 3.33% Max. error of ratio = (0.709-0.625)/0.625 = 13.44%
It is conventional to represent the distributions of data horizontally, rather than vertically.
Insect Activity vs. Temperature Understand both the form and magnitude of the effect.