
Student Achievement data reporting
E N D
Presentation Transcript
Student Achievement data reporting CCSD August 2014
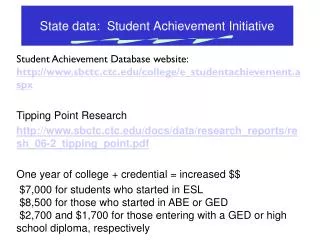
ASSESSMENT DATAWhat is its purpose? • Monitor our student achievement progress through standardized assessment: trends, comparisons, and big picture lens • Report progress, gaps, and goals to our stake holders: CCSD families, school board and SIAC, school teams, and the state • Set goals for growth and closing achievement gaps based on identified trend data
ASSESSMENT DATAWHAT ISN’T its purpose? • Drive instruction—it is not used in a formative way as a primary resource to drive instructional groups or daily planning • Judge schools or districts—good vs. bad • Drive curriculum choices or instructional design
WHAT ARE YOUR BIG PICTURE THOUGHTS? • What does the data overtime tell us? • What does the “zoom in” data tell us about grade levels and subgroups? • What can we celebrate? • What goals do we need to set?
AYP SINA AND DINA
AYP—Even a closer look • NCLB requires schools to meet AYP (Adequate Yearly Progress) • Achieve a state set objective for proficiency in reading and math – grades 3rd-5th • The proficiency level has increased across years, this year’s objective was 100% proficient
Why our elementary schools did not make reading AYP • In 2013-2014, Prairie 4th grade students in the designated schools did not meet the AYP goal of 100% or the growth formula in the area of Reading • In 4th grade 69.78 - 77.27% of the total tested students on the Iowa Assessments were proficient and in the white sub-group 70.51-82.84% of students were proficient • Hill was designated as SINA because the majority of it’s students came from a SINA school
School Achievement Data (percent proficient in Reading and Math) 2013-2014 School Year
CELEBRATION/IMPROVEMENT IN RELATION TO AYP • Our Elementary teaching and para-professional staff are considered “highly qualified” according to the definitions of NCLB • All of our elementary schools tested 100% of our students and met the required 95% participation rate • All of our elementary buildings showed improvement in the area of math and none are SINA schools this year
Continuous Improvement • Collaborating through grade-level learning teams to monitor student data to guide instruction • Fostering students’ ability to create high quality work through goal setting and self- and peer-assessment • Developing and implementing formative assessments to differentiate instruction • Implementing flexible, small group and individualized instruction to improve students’ skills