Fermentation Kinetics
Fermentation Kinetics. Alfred Carlson. Fermentation Kinetics. There are 4 things to understand about cell growth Cell growth is exponential The specific growth rate depends on environmental conditions

Fermentation Kinetics
E N D
Presentation Transcript
Fermentation Kinetics Alfred Carlson
Fermentation Kinetics • There are 4 things to understand about cell growth • Cell growth is exponential • The specific growth rate depends on environmental conditions • An empirical equation called the Monod equation is used to relate specific growth rate to the substrate concentration in the media • Production of products
Scenario • A 1 L reactor containing 2g/L of glucose in a minimal media was inoculated with 1 cc of an overnight shake flask culture. The OD of the shake culture was measured to be 7. For the next 16 hours, samples were taken from the reactor every 2-3 hours and the OD was measured in a spectrophotometer @ 600 nm. The results are on the next slide.
Bioreactor Sampling for OD (hurry – the cells are still growing) Absorbance reading Photodetector Below a reading of 0.7 AU, absorbance a to cell concentration For E. coli 1 AU ~ 0.5 g/L dry or 1.5 – 2 g/L wet cells
Results • Time (hr) OD reading 0 ND (not determined) 2 0.007 4 0.02 7 0.06 10 0.18 12.5 0.45 15 1.45
What you do with this data • The “specific growth rate” is a parameter that characterizes the cell growth and is another way of measuring the “doubling time” If the cells are growing right, they will have a constant specific growth rate that falls in a “normal range”.
Steps - Plot • Plot the data on a semilog plot of (log) OD vs t – this gives you a big picture view of the data.
Steps - Regress 2. Fit the data using an exponential growth model OD = ODoexp{mt} Be careful how you fit the data. Exponential trendline weights data one way, least squares another.
Fitting to Monod model • Use Monod, substrate limited kinetics to model the growth of these cells. Predict the entire growth curve and predict the glucose depletion curve for the cells based on a yield factor of 0.5 gcells/gram glucose.
Monod model • The Monod model accounts for the fact that the cells specific growth rate decreases (doubling time increases) when the concentration of food is low. This is the most common growth model. m = mmax*S/(Ks+S)
Using the Monod model • Either you have to solve 2 simultaneous differential equations, or you have to do periodic update material balances: • Cell balance = dX/dt = mX • Substrate balance dS/dt = -mX/Yx/s Remember: m = mmax*S/(Ks+S)
Lecture slides • Doubling time vs specific growth rate • Temperature effect on specific growth rate • Ribosome limited growth • Product expression models
Cell Doubling • Cells grow by doubling at regular intervals td td td
Culture Kinetics • Exponential Growth • Specific growth rate N DN/Dt 1 1 2 2 4 4 8 8 dt dt dt dN/dt = mN
Exponential growth • As long as the doubling time remains constant, the specific growth rate (m) will remain constant. Number of cells at t = 0 N = No exp{mt) dN/dt = mN Ln {N/No} = mt
N, Cell mass, OD • For constant volume reators – The number concentration of cells n (cells/L) is proportional to N (n = N/V). The cell mass is proportional to N, and OD is proportional to n. – All measurements of cell growth follow exponential law.
Doubling Time and Specific Growth Rate • The specific growth rate is just another way of expressing the doubling time. During a doubling time N/No = 2 Ln(N/No) = Ln(2) = 0.693 = mtd td = 0.693/m
Culture Kinetics Cell type doubling time growth rate (hr-1) bacteria 20 – 90 min ~0.3 - 2.1 yeast 45-120 min ~0.2 – 1.0 mold 4-8 hours ~0.1-0.2 mammalian cells 20-48 hours ~0.05 These are just rough numbers, not rules.
Example • A certain yeast cell is said to have a doubling time of 90 minutes. What is its specific growth rate in hr-1? A 1 cc inoculum of the same cells at an OD of 5 (600 nm) is used to inoculate 1 L of fresh media. How long will it take for the new culture to reach an OD of 1? of 5?
Answers • A certain yeast cell is said to have a doubling time of 90 minutes. What is its specific growth rate in hr-1? • m = 0.693/td td = 1.5 hr m = 0.693/1.5 = 0.462 hr-1
Answers • A 1 cc inoculum of the same cells at an OD of 5 (600 nm) is used to inoculate 1 L of fresh media. How long will it take for the new culture to reach an OD of 1? Of 5? Ln (OD/ODo) = mt ODo = 5/1001 ~ 0.005 t1 = ln (1/.005)/0.462 = 11.5 hours t5 = ln (5/.005)/0.462 = 14.95 hours
Environmental Conditions • The specific growth rate is the fastest the cells can double on that particular media at that particular temperature. mesophile thermophile psychrophile m 0 35 60 Temp C
pH effect m 4 8 pH
pH effect • Optimum growth below 4 – acidophiles • Optimum growth between 6 and 8 – mesophiles • Optimum growth above 8 - alkaliphiles
Maximum growth rate determined by ribosomes • In order for cells to double regularly they need to duplicate their duplication system in the doubling time. • Only 16 amino acids per second can be added to a growing protein chain (ribosome limit)
Limits to Cell Growth Rate For cells to grow they must reproduce themselves This requires (minimum) the reproduction of the reproduction system (PSS) PSS PSS PSS PSS time -------
Limits to Cell Growth Rate • Translation is rate limiting • Time required for ribosome self-reproduction is minimum doubling time
Limits to Cell Growth Rate • Reproduction time = Number of amino acids per ribosome Rate of amino acid addition to protein chain
Limits to Cell Growth Rate • 10,000 amino acids/ ribosome • 15 -20 amino acids added per second ~ 600 seconds (10 minutes) to reproduce a ribosome • 10 minutes for ribosomes to reproduce ribosomes
Limits to Cell Growth Rate • Production of other proteins slow down ribosome reproduction • minimum need is 20,000 aa/ribosome = 20 minute doubling time (observed = 17 minutes or so) • More complex cells = more aa addition = slower growth
Limits to Cell Growth Rate • On poor media cells must make more proteins for getting and processing food ---- slower growth • When cells produce product, more protein is needed for these processes ---- slower growth
Limits to Cell Growth Rate • Net effect of engineering on cells (ideal) • Ribosomes diverted from required functions • growth rate cut proportional to 2 x fraction of foreign protein produced -- at 50% protein growth rate = 0
Cell Growth Modeling • When there is no substrate, cells can’t double and m goes to zero • No matter how much substrate, cells can only double so fast (m goes to mmax)
Monod Equation • Growth equation (Monod equation) m = mmax S/ (Ks +S) Specific growth rate Substrate conc (S)
Stationary Phase Growth equations with substrate exhaustion: Cells: (rate of change of cell concentration) dX/dt = mX = mmaxS/(Ks + S) * X Substrate: (rate of change of substrate conc) dS/dt = -1/Yx/S dX/dt = -1/Yx/SmmaxS/(Ks + S) X
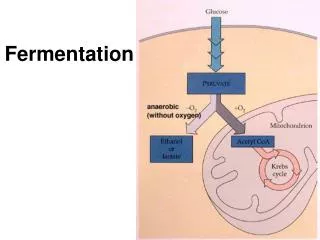
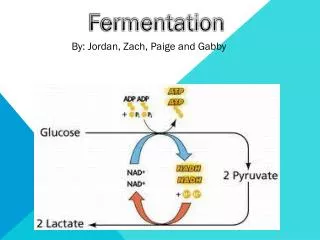
Products • Metabolites (stoichiometric) • Example: how much ethanol can a cell make from a gram of glucose: (Facts – hardly any cell mass therefore follow glycolytic pathway to ethanol.)( 2 moles per mole glucose) 1 gram = .0055 moles .0110 moles ethanol x 46 g/mole = 0.5 grams. The rest is CO2. • Rate of ethanol production = rate of glucose consumption x 2
Products • Non-metabolites (2 broad types) • Growth associated products • Example: Cell components: Cells must be growing to produce product. dP/dt = b dX/dt = bmX g/g-cells gcells/L g/L-hr hr-1
Products • Non-metabolites (2 broad types) • Non-Growth associated products • Example: Penicillin dP/dt = aX Substrate Product g/gcells-hr gcells/L g/L-hr
Overall Production Coefficient • Production coefficient dP/dt = (bm + a) X dP/dt = qpX g/L-hr g/gcells-hr
Summary • Cell growth kinetics are described by either the doubling time or the specific growth rate. • Monod kinetics take into account that cells stop growing when the substrate runs out. • Ultimately cells grow at a certain rate because of what the ribosomes are doing • Product expression kinetics are either related to the consumption rate of precursors or to empirical patterns of expression called growth related or non-growth related expression