Download
1 / 17
170 likes | 353 Views
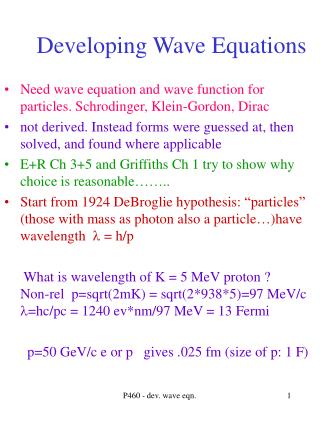
Developing and non-developing TC on positive and negative phase of Rossby wave. Lin Ching 24 Sep 2013. Day -1. Day 0. Day 1. Day -1. Day 0. Day 1. Day -1. Day 0. Day 1. Day -1. Day 0. Day 1. Upper-level processes in tropical cyclogenesis.

E N D
Developing and non-developing TC on positive and negative phase of Rossby wave Lin Ching 24 Sep 2013
Day -1 Day 0 Day 1
Day -1 Day 0 Day 1
Day -1 Day 0 Day 1
Day -1 Day 0 Day 1
Upper-level processes in tropical cyclogenesis Cecelski, S. F. and D.-L. Zhang, 2013: Genesis of Hurricane Julia (2010) within an African Easterly wave: low-level vortices and upper-level warming. J. Atmos. Sci., doi:10.1175/JAS-D-13-043.1. Zhang, D.-L. and H. Chen, 2012: Importance of the upper-level warm core in the rapid intensification of a tropical cyclone. Geophys. Res. Lett., doi:10.1029/2011GL050578. Zhang, D.-L. and L. Zhu, 2012: Roles of upper-level processes in tropical cyclogenesis. Geophys. Res. Lett., doi:10.1029/2012GL053140.
WRF nested-grid (27/9/3/1 km) WRF 1km Shaded: T’ Contour: θ storm-relative flows Hydrostatic equation: • The isentropic surfaces descend to their lowest altitudes with the peak warm core • The peak warming is more than 18oC near Z=14 km • The warming core of stratospheric origin could contribute more than twice as much as the lower-level warming column to pressure changes during the RI. Curve A: Pmin (p’) Curve B: p’ above 380-K surface Curve C: p’ beneath 380-K surface
Upper-level convergence and subsidence in the eye Cyclonic inflow Strong divergent outflow T = 30 h Z = 17.5 km
Concluding Remarks • The formation of an upper-level warming core, coinciding with the onset of RI, due to the descent of stratospheric air. • The upper divergent outflow layer favors the generation of a warm core by protecting it from ventilation by environmental flows. • Based on a hydrostatic argument, the upper-level warming in the eye is more effective than the lower-level warming in causing surface pressure falls.
Genesis of Typhoon Nari (2001): An “Ideal” Storm The warming column increases in magnitude and expands in depth with time. The warming core remains at 200 hPa throughout the 96-h period. The upper-level warming rate increases more significantly near 36 h, which coincides with the onset of significant intensification (SI). The increased upper-level warming rate near 36 h explains well the trigger of Nari’sSI. Warming at lower temperatures aloft is more effective than the lower-level warming in hydrostatically inducing MSLP falls. 78% of the MSLP changes 4-hPa drop 30-hPa drop UW: upper-level warming only dT(z, t) > 0 in the 100–300 hPa layer
6 h prior to, 6 h after and 18 h after the onset of SI Typical in- up- and outward circulation The warming core grows in intensity and volume with time during SI, under the protection of a deep-layer divergent circulation in the outer region.
Genesis of Typhoon Chanchau (2006) Under Intense Vertical Wind Shear The onset of SI is triggered until 192-h. The upper-level warming is peaked in the 400–450 hPa layer. Intense VWS with the peak magnitude of greater than 6 x 10⁻¹ s-1 centered at 320 hPa and intense SRFs with the peak magnitude of greater 20–25 m s-1in the peak warming layer until the onset of SI. The increased warming depth and rate near 192 h that trigger the SI of Chanchau. If only the peak warming layer of 300–500 hPa is considered (curve UW2), the storm is weaker than that shown in UW1 (166–500 hPa).
3 h prior to, 9 h after and 36 h after the onset of SI The intensification of a warm core near 400 hPa within the radius of more than 200 km from 2oC at 189 h to 6oC at 201 h, and 7oC at 228 h.
Concluding Remarks • The upper-level warming accounts for more than 75% of the MSLP changes. • The higher-level warming is more effective than the lower-level one in hydrostatically inducing MSLP falls. • The onset of TCG is triggered when more rapid warming and increased warming depth take place in the upper troposphere where both VWS and SRFs are weak or significantly reduced. • Given warm SSTs and other favorable conditions, the upper-level processes, especially, VWS and SRFs, play critical roles in determining the onset of TCG. • Even with all favorable low-level conditions, TCG may not likely occur if an upper-level warm column could not be established due to the detrimental impact of intense upper-level VWS and ventilation.
600hPa relative vorticity zonal wind co-moving streamlines 9, 3, and 1 km 66 hours simulation 36 vertical levels model top is 50 hPa
The LLV is intensifying with time and begins to merge with the vertically tilted AEW vortew from the top
The merging of the LLV and AEW is realized by the bottom-up growth of cyclonic vorticity associated with the LLV and the mid-level cyclonic vorticity of the AEW.