Download
1 / 14
140 likes | 161 Views
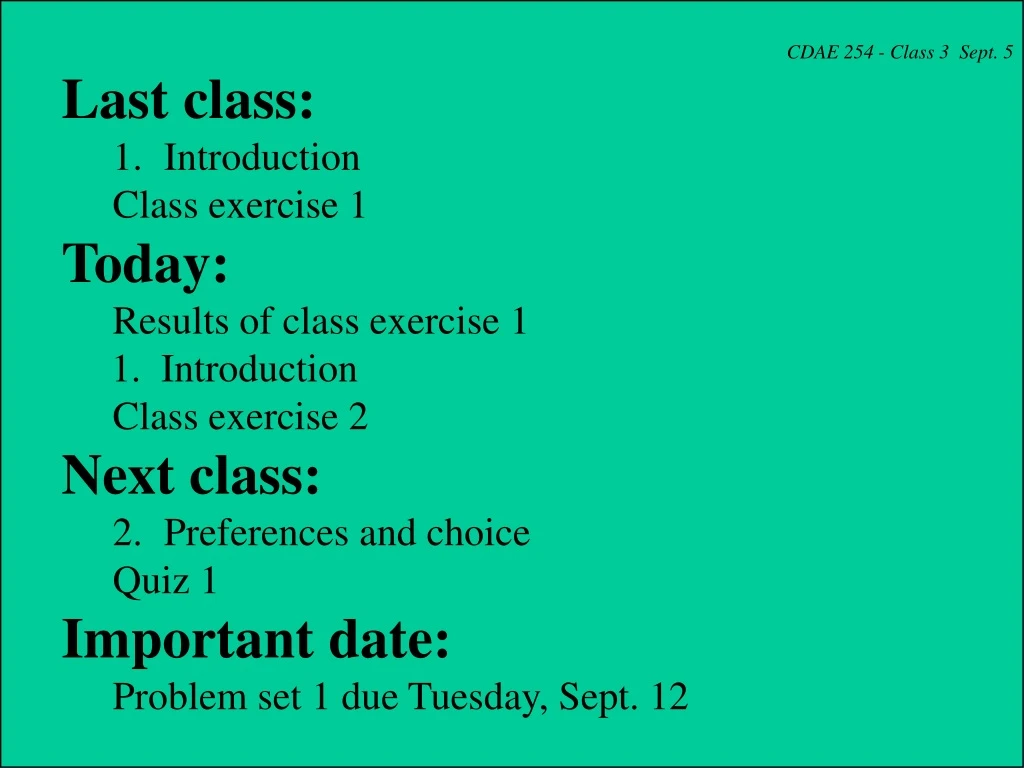
CDAE 254 - Class 3 Sept. 5 Last class: Introduction Class exercise 1 Today: Results of class exercise 1 1. Introduction Class exercise 2 Next class: Preferences and choice Quiz 1 Important date: Problem set 1 due Tuesday, Sept. 12. 1.1. Overview of an economy

E N D
CDAE 254 - Class 3 Sept. 5 • Last class: • Introduction • Class exercise 1 • Today: • Results of class exercise 1 • 1. Introduction • Class exercise 2 • Next class: • Preferences and choice • Quiz 1 • Important date: • Problem set 1 due Tuesday, Sept. 12
1.1. Overview of an economy 1.2. Economics and microeconomics 1.3. Economic models and applied economic analysis 1.4. Development of economic models 1.5. Verification of economic models 1.6. Ten principles of economics 1.7. Functions and graphs used in economics 1. Introduction
1.7. Functions & graphs used in economics 1.7.1. How to express economic relations? 1.7.2. Functions of one variable 1.7.3. Graphing functions of one variable 1.7.4. Functions of more than one variable 1.7.5. Graphing functions of two variables 1.7.6. Simultaneous equations 1.7.7. Derivatives
1.7.1. How to express economic relations? (1) Three ways to express economic relations: -- Functions (equations) -- Graphs -- Tables (2) Advantages and disadvantages:
1.7.2. Functions of one (independent) variable (1) General notation: Y = f (X) Y is a function of X Y is the dependent variable X is the independent variable (2) Linear function: Y = a + b X Y is a linear function of X a is the intercept (constant) b is the slope (constant)
1.7.2. Functions of one (independent) variable (2) Linear function: e.g., Y = 5 + 0.2 X Qd = 20 – 0.5P (3) Nonlinear function: e.g., Y = 20 + 0.5 X - 0.02 X2 Y is a nonlinear function of X
1.7.3. Graphing functions of one (independent) variable (1) Linear functions (a) How to graph a linear function? e.g., Y = 6 – 0.4X (b) Interpretation of intercept and slope e.g., Y = 6 – 0.4X (c) Changes in intercept e.g., Y* = 10 – 0.4X (d) Changes in slope e.g., Y** = 6 – 0.8X (e) Change in both intercept and slope e.g., Y*** = 10 – 0.8X
1.7.3. Graphing functions of one (independent) variable (2) How to graph a nonlinear function? -- Identify several points -- connect the points by a smooth curve.
1.7.4. Functions of more than one (indep.) variable (1) General notation: Y = f (X, Z) Y is a function of X and Z Y is the dependent variable X and Z are the independent variables (2) Examples and interpretations: Y = 20 + 0.5 X + 0.2 Z Qbeef = 20 – 0.2 Pbeef + 0.1 Ppork
1.7.5. Graphing functions of two (indep.) variables -- Three dimension graphs -- Examples: indifference curve and isoquant
1.7.6. Simultaneous equations -- Definition: A set of equations with two or more variables that must be solved together for a particular solution. -- Example: Supply and demand -- General procedures for a set of two equations: (1) Get ride of one variable (2) Get the solution for one variable (3) Substitute the solution back into any of the two equations to get the solution for the other variable.
1.7.6. Simultaneous equations -- Examples: Y = 20 – 2X 4X – Y = 10 Qd = 10 – P Qs = – 5 + 2P
1.7.7. Derivatives and optimization (a) How to calculate derivatives? a) Interpretation and notation b) Rules of finding derivatives c) Examples (b) How to derive the maximum or minimum value of a nonlinear function? 1) Derive the first derivative 2) Set the first derivative to be equal to zero 3) Solve for the independent variable 4) Substitute the solution back to the function to get the maximum or minimum value of the function
1.7.7. Derivatives and optimization (c) Applications – why do we need to learn derivatives in economics? 1) Profit maximization: profit = – 50 + 2 q – 0.01 q2 2) Average cost (AC) minimization AC = 120 – 0.8 q + 0.002 q2


