Economics Quiz Questions and Answers | Test Your Knowledge
280 likes | 356 Views
Test your understanding of economics concepts with this quiz, covering topics such as food expenditures, specialization, scarcity, utility maximization, demand curves, and more. Challenge yourself now!

Economics Quiz Questions and Answers | Test Your Knowledge
E N D
Presentation Transcript
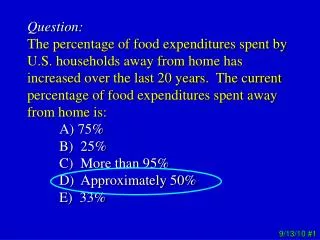
Question: The percentage of food expenditures spent by U.S. households away from home has increased over the last 20 years. The current percentage of food expenditures spent away from home is: A) 75% B) 25% C) More than 95% D) Approximately 50% E) 33% 9/13/10 #1
Question: Many countries tend to specialize in the production of particular commodities. With specialization: A) The same amount of commodities will be produced B) Only 1 commodity will be produced C) More of at least one commodity will be produced D) On net, all countries will be better off E) Both (C) and (D) 9/13/10 #2
Question: Economics is concerned with how scarce resources are allocated across competing uses. Why can your time be considered a scarce resource? • It really can’t be a scarce resource since everyone has the same amount of time • Because there is a finite number of hours in a day • Because time does not have a value • It really can’t be a scare resource since it is not a physical commodity or good • Both A and D 9/15/10 #1
Question: • I have enrolled about 15 acres of my cropland in the Conservation Reserve Program (CRP). Under CRP I am not allowed to cultivate or graze covered acreage but I am required to maintain native grasses for erosion control. This cropland is zoned only for agricultural use. Which of the following can be considered the opportunity cost of enrolling in the CRP? • $750 since that was my property tax bill last year • $35,000 since that is the current price of rural • residential building lots in the area • $1,250 since that is my profit from growing corn • $2,250 since that is my profit from growing soybeans • $0 since I already own the land 9/15/10 #2
Question: Suppose you are analyzing the prices received by Florida citrus growers. You collect data encompassing the 1970-2009 period. You find the price index received by farmers in 2009 was 0.97 with 1990 used as the base year. • Relative to 2009, citrus prices were 97% higher in 1990 • Relative to 1990, citrus prices were 3% lower in 2009 • Relative to 2009, citrus prices were 3% lower in 1990 • Relative to 1990, citrus prices were 97% higher in 2007 • None of the above 9/20/10 #1
Question: Marginal utility (MU) is the change in one’s utility obtained from the consumption of an additional unit of a particular good, ceteris paribus. This definition implies the following: • Your utility is maximized at the consumption level where your MU has a large positive value • Your utility is maximized at the consumption level where your MU is zero • MU is the slope of the utility function • Both (A) and (C) • Both (B) and (C) 9/20/10 #2
Question: Suppose you have the indifference curve shown to the right. What is the MRS of Tacos for Hamburgers when moving from A to B? 9 8 A 7 6 5 Taco Consumption per Week 4 3 100 Utils B 2 1 1 2 3 4 5 6 Hamburger Consumption per Week • –1.25 • 0 since they are different goods • 0 since these two good combinations on the same indifference curve • 1.25 • –5.00 9/22/10 #1
Question: Suppose you have a budget line represented by AB. What causes this budget line to shift to CB? 9 A 8 7 6 5 Taco Consumption per Week C 4 3 2 1 B 1 2 3 4 5 6 Hamburger Consumption per Week • Price of Hamburgers Doubling • Price of Hamburgers Decreasing by 50% • Price of Tacos Doubling • Price of Tacos Decreasing by 50% • Both choice (A) and (C) above 9/22/10 #2
Budget Constraint Question: Suppose you have the indifference curve and budget line shown to the right. At equilibrium pt. A we know the MRS between Good 1 and Good 2 is: 9 Indifference Curve 8 7 Good 1 Consumption 6 5 A 4 3 2 100 Utils 1 1 2 3 4 5 6 • 0, since by definition A identifies the utility max. combination of goods • -2 • Equals the negative of the price ratio • B and C • Not defined since the prices of the two goods are unknown Good 2 Consumption 9/27/10 #1
Question: We use the utility maximizing solution to the allocation of our fixed budget to derive a commodity’s demand curve. We do this by examining how the amount of this good that is purchased changes as a result of: • Changes in availablebudget • Changes in the price of other goods • Changes in the price of that particular good • Both A and C • Changes in indifference curve shape 9/27/10 #2
Question: A good is referred to as an inferior good when: • That portion of the demand curve has a negative slope • That portion of the demand curve has a positive slope • That portion of the Engel curve has a positive slope • That portion of the Engel curve has a negative slope • Both A and C 9/29/10 #1
Question: A perfectly inelastic demand curve will have the following charactistic(s): • The demand curve graph will be a vertical line • Quantity demanded will not change with price • Consumer surplus is 0 • A, B and C • None of the above 9/29/10 #2
Good 2 Question: Could we have two indifference curves that look like those in this indifference map? U1 < U2 U2 U1 Good 1 • Yes, because they are both negatively sloped • No, because the MRS on the U1 indifference curve cannot equal the MRS on the U2 indifference curve • Yes, because you can have a negative MU • No, because the same bundle cannot make for 2 different levels of satisfaction • Both B and D 10/4/10 #1
Question: Why does it make sense that if you have a good exhibiting inelastic demand that total expenditures on this good will increase with a price increase? • It does not make sense as you must decrease your demand for a good when prices increase • It makes sense because that portion of the demand curve has a positive slope • It does not make sense since goods with inelastic demand are normal goods • It does make sense since the % change in quantity is less than the %change in price • It does make sense since goods with inelastic demand are inferior goods 10/4/10 #2
Question: Suppose I examine the relationship between the demand for two goods and find that they are substitutes. This implies: • A) ηij > 1.0 • ηij < 1 • ηij > 0 • ηij > 0, ηij < 1 • ηij > 0, ηii < 0 10/6/10 #1
Question:APP is calculated as the total amount of output produced divided by the total amount of input used. One can identify the input level that results in the maximum APP via one of the following conditions: • TPP is at a maximum • MPP is < 0 • MPP = 0 • MPP = TPP • MPP = APP 10/6/10 #2
Question: Why does it make sense that producers will want to use a variable input in the range where MPP > APP • It makes sense as this means the marginal input is adding more than that added by smaller amounts of the input • It makes sense because that means the MPP > 0 • It does not make sense since this means the APP would be greater for larger amounts of the input • It does make sense since this means the APP is declining • It does not make sense since this means the TPP is declining 10/11/10 #1
Question: Assume you are a dairy farmer in Fond du Lac county Wisconsin where you milk 300 cows. The opportunity cost of your time is • $0 since last year your farm did not earn a profit • The minimum wage = $7.25/hour x 40 hrs/week x 50 weeks = $14,500 • $0 since you own the farm • $45,000 the average salary of a farm manager in WI • The price of milk x amt. of milk produced/cow x 300 cows 10/11/10 #1
Question: Assume you have a firm using a single variable input in a perfectly competitive industry and exhibits the classic shaped MPP curve except that MPP > 0 over all inputs. This means: • The MC curve will be U-shaped • There is a level of input use that maximizes the TPP • The AVC curve will always be above the MC curve • The AVC curve will decline over all output levels • Both A and D 10/11/10 #2
Question: Assume you are in a perfectly competitive industry, produce an output with a single input, you know the MPP schedule of this input and you know its price. To maximize profit you • Find the output level where MC = 0 • Use the one input to the point where MPP = (Input Price/Output Price) • Find the input level where MC = (Input Price/MPP) • Find the output level where MC=Output Price • Both B and D 10/13/10 #1
Question: Assume you are in a perfectly competitive industry andproduce an output with two inputs. To minimize the cost of producing Q* amount of output you need to find the input combination the generates the following: • Slope of the isoquant = 0 • Ratio of the inputs MPP’s = input price ratio • Each inputs MPP/input price ratio are equal • Each input’s MPP = 0 • Both B and C 10/13/10 #1
Question: At the Chicago Mercantile Exchange yesterday, the futures price for corn for Dec. delivery ↑ to a record of more than $5.84/bushel. If these high prices were to continue for next year which of the following would not be true? • Farmers would apply less nitrogen fertilizer • Farmers would produce more corn • With fixed fertilizer prices, we would expect a level of fertilizer use where the MPP is lower than this year • It is more likely that AFC will be covered • The MC of production will be greater than the minimum AVC 10/13/10 #2
Question: • It is not surprising that an isoquant should be negatively sloped because: • The firm is operating in Stage I of production • The firm is operating in Stage II of production • The firm is operating in Stage III of production • The MVP of both inputs are ↑ with ↑ use • Both A) and B) I1 Q=Q* I2 10/18/10 #1
Question: It is not surprising that the input combination that generates the minimum cost of producing a particular output is: • Located on either the vertical or horizontal axis • Located at a point below the desired isoquant • Not dependent on the price of either input • At a combination where the MRTS = input price ratio • At a combination where the MPP of one of the inputs is 0 10/13/10 #2
Question: Assuming the cost minimizing model of the firm, if the firm has following short run production function: Q = f(K, L | Other Inputs) and the price of capital increases: A) The firm’s demand for capital will increase B) The firm’s demand for labor will increase C) The firm’s demand for labor is not impacted D) The firm’s total variable cost of producing Q* will decrease E) Both A) and B) 10/20/10 #1
Question: The shape and location of the firm’s production possibilities frontier is: • Dependent on the technology available to the firm to transform inputs to products • Dependent on the relative prices of the two products being produced • Dependent on the relative prices of the inputs used to produce the products • Both A and B • Both A and C 10/13/10 #2
Question: The firm’s production possibilities frontier is: • Dependent on the output prices that exist in the economy • Technical in nature • Always a straight line • Dependent on the input prices that exist in the economy • Both A and D 10/25/10 #1
Question: The profit maximizing combination of outputs that will maximize the firm’s profits are: • On the boundary of the PPF • Dependent on the relative prices of the two products being produced • The combination of outputs where the change in revenue from one product is just offset by the change in other product’s revenue • A, B, and C • Only A and B 10/25/10 #2