Download
1 / 10
100 likes | 341 Views
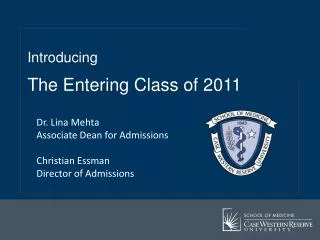
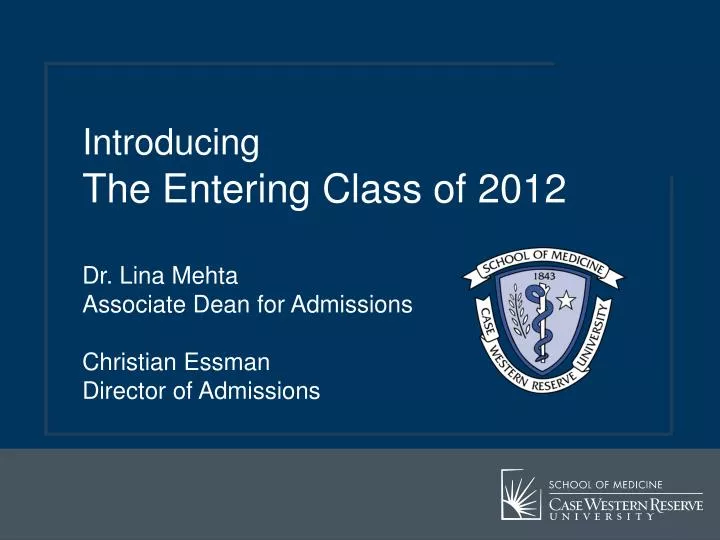
Introducing The Entering Class of 2012. Dr. Lina Mehta Associate Dean for Admissions Christian Essman Director of Admissions. Interview Statistics. Total Applications Nationally: 42,300 Total Individual Applications to CWRU: 5,494 Total in the Entering Class: 198. University Track

E N D
IntroducingThe Entering Class of 2012 Dr. Lina Mehta Associate Dean for Admissions Christian Essman Director of Admissions
Interview Statistics Total Applications Nationally: 42,300 Total Individual Applications to CWRU: 5,494 Total in the Entering Class: 198 • University Track • Applications: 4,861 • Interviews: 879 • Matriculants: 152 • College Track • Applications: 1,709 • Interviews: 250 • Matriculants: 32 • MSTP • Applications: 343 • Interviews: 71 • Matriculants: 14
Demographics Entering Class Size: 198(University Track, College Track, & MSTP) • 45.0% Female • UP 47.4% Female • CCLCM 37.5% Female • MSTP 35.7% Female • Average Age 24.1; Age Range: 21-34 • UP Avg. Age: 23.7 Range: 21-34 • CCLCM Avg. Age: 23.1 Range: 21-30 • MSTP Avg. Age: 23.2 Range: 22-28
Demographics Race and Ethnicity (198): 39.4% White (78) 13.1% Chinese (26) 11.6% Asian Indian (23) 8.1% Black or African American (16) 4.0% Mexican, Mexican American (8) 3.0% Korean (6) 2.0% Cuban/Hispanic/Latino/Latina (4) 2.0% Spanish/Hispanic (4) 1.5% Other Asian (3) 1.5% Filipino (3) 0.5% Japanese (1) 0.5% Puerto Rican, Spanish (1) 0.5% Samoan (1) 11.6% Did Not Report (23) * Based on self-reported description on AMCAS
31 States of Residence & 3 Countries 2 NH-2 ME-1 MI-18 4 4 MA-2 4 OH-40 7 1 1 3 CT - 2 1 10 1 1 NJ - 7 11 1 1 2 3 4 2 2 30 MD-13 31 4 32 NC-2 2 4 SC-1 5 32 1 Canada - 4 China - 1 Nigeria - 1 3 Countries: 20.2% In-state 79.8% Out-of-state
Undergraduate Colleges and Universities Attended • To name a few 82 Different Schools
Majors and Graduate Degrees Other Areas of Study: • Nutrition • Optometry • Linguistics • Statistics • Geology • Geography • Classics • Nursing
Extracurricular/Avocational Activities Individual StudentsTotal Exps. Clinical volunteer experiences 168 345 Non-clinical volunteer experiences 147 240 Research experience 185 385 Publications 41 58 Presentations/Posters 52 68 Tutoring/Teaching 119 155 Artistic Interests 27 38 Intercollegiate Athletics 29 30 Employment 147 302 Honors/Awards/Recognitions 142 285 * As classified on AMCAS
Facts Just For Fun • Most Common… • Instrument: Piano • Boy’s name: Daniel (5) & Michael (6) • Girl’s name: Sarah/Sara (3) • Birthdates (3/each): 3/19, 3/26, 4/10, 7/27, 8/21, 10/6, 11/28, 12/16 , 12/20 • Peace Corps Member – Senegal • Fulbright Scholar • High School Science Teacher • Transplant Fly Out Nurse • Semi-pro football Player • Artists, Dancers, and Musicians • Consultants and a Finance Manager • Concierge, Waiters/Waitresses, & Bussers • Costume Shop Assistant • Numerous Athletes – Varsity, Club, and Intramural • Fitness Trainer & Yoga Instructor • Boy Scout Den Leader • Starbucks Barista • Standardized Patient • Member of U of Notre Dame Marching Band • Medical School Dean’s Office Assistant • Husbands, Wives, Moms, and Dads