Download
1 / 12
120 likes | 137 Views
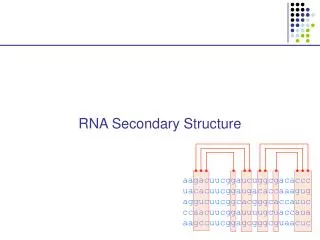
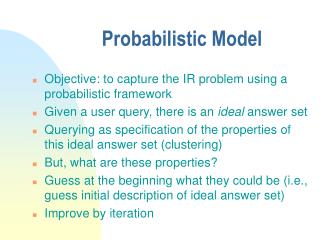
This project presents a continuous probabilistic model for local RNA structure using Dynamic Bayesian Networks. By representing RNA angles as random variables and employing Von Mises distributions, the model accurately captures local structure dependencies. The model is evaluated for individual and pairwise angle distributions, showcasing its effectiveness in generating decoys for RNA structures through a simulated annealing scheme. Applications include RNA 3D structure prediction and quality validation for experimental data.

E N D
T H E B I O I N F O R M A T I C S C E N T R E A continuous probabilistic model of localRNA 3-D structure Jes Frellsen The Bioinformatics Centre Department of Molecular Biology University of Copenhagen
T H E B I O I N F O R M A T I C S C E N T R E Background • 3D structure is important for understanding the function of non-coding RNA molecules • Experimental methods for determining 3D structure are time consuming and sometimes difficult • Local structure is typically modeled by using discretization • E.g. fragment libraries are used in current methods for structure prediction • Our group has recently made a continuous probabilistic model of local protein structure with great success[PLoS Comput Biol 2006, 2:1121-113] • Dynamic Bayesian Networks • Directional statistics • We have used a similar approach to model local structure of RNA
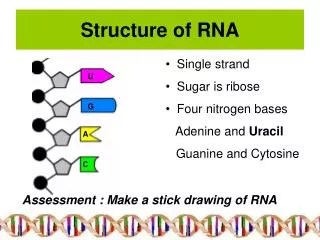
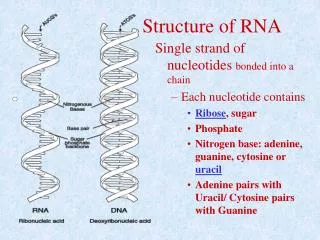
T H E B I O I N F O R M A T I C S C E N T R E Representation of RNA • Each nucleotide in an RNA molecule can be represented by the base type and 7 dihedrals angles • Allows for accurate conversion into coordinates of all atoms in the structure using standard values
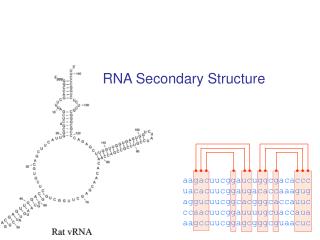
T H E B I O I N F O R M A T I C S C E N T R E Angle distributions • Each variable lies on a circle • Requires directional statistics • Each variable is multi-modal • Can be described by a mixture of simple distributions • Von Mises distribution • The angles co-vary both within nucleotides and between consecutive nucleotides • We model this by a sequential model
T H E B I O I N F O R M A T I C S C E N T R E Our model • An DBN with 3 random variables per angle: • Discrete input variable indicating angle type (7 states) • Hidden variable with 20 states • Output variable representation the angle value and the CPDs given the hidden state is modelled by Von Mises distributions • Structure of an IOHMM with continuous output (except bookkeeping) • Does not impose a groping of the angles • Parameters are estimated by stochastic EM from experimental data
T H E B I O I N F O R M A T I C S C E N T R E Evaluating the modelIndividual angle distributions • The model captures the distribution of the individual angles • E.g. the -angle and the -angle:
T H E B I O I N F O R M A T I C S C E N T R E Evaluating the modelPairwise distribution • The model captures the pairwise dependencies between the angles • E.g. the pairwise distribution of and (inter-nucleotide)
T H E B I O I N F O R M A T I C S C E N T R E Proof of concept: generating decoys for a target structure • A simple simulated annealing scheme: • Sample a whole structure, S, without clashes • Make new structure, S’, by resampling four consecutive angles in S (randomly picked) • Evaluate S’ • If it has clashed it is rejected • If it has a better energy than S then S’ is set to be the new S • If it has a worse energy then with probability, p, S’ is set to be the new S (otherwise it is rejected) • Go to step 2 • In the scheme we used • p = e(E-E’)/T , where T decreases with time • a simple “energy function” that promotes structure with the same Watson-Crick base pair as are found in the target structure
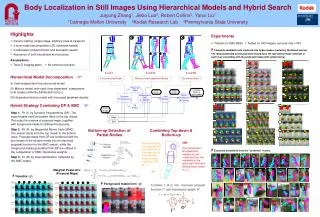
T H E B I O I N F O R M A T I C S C E N T R E Results of generating 1,500 decoys for 5 different structures Target structure Best decoy 1ZIH
T H E B I O I N F O R M A T I C S C E N T R E Perspectives • The model assigns a probability distribution to the conformational space and describes many aspects of local RNA structure well • It has numerous applications! • It allows for fast probabilistic sampling of locally RNA-like structures • Can thus be used in RNA 3D structure prediction • The model can be used to calculate the probabilities of seeing different local structures • Can thus be used for quality validation of experimentally determined structures
T H E B I O I N F O R M A T I C S C E N T R E Acknowledgements • The research was conducted in the structural bioinformatics group, lead by Thomas Hamelryck, byJes Frellsen, Ida Moltke, Martin Thiim and Thomas Hamelryck • We would like to thank • Our collaborator Senior Research Professor Kanti V. Mardia from The University of Leeds for his contributions on directional statistics. • The Richardsons Lab at Duke University for making their RNA dataset available • JF thanks IMA for the invitation to the conference • JF is funded by The Danish Council for Strategic Research • TH is funded by The Danish Council for Technology and Innovation
T H E B I O I N F O R M A T I C S C E N T R E Bayesian Networks andDynamic Bayesian Networks • A BN is a DAG where • Nodes are random variables • Edges represent conditional dependencies in the factorization of the joint probability • The graph encodes conditional indepencies • E.g. A and D is conditional independent give C • DBNs are the time series expansion of BNs • E.g. an HMM: