Download

1 / 4
40 likes | 192 Views
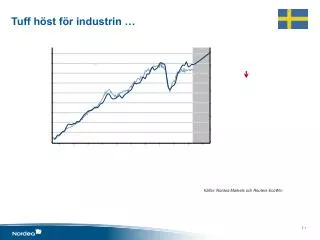
Facken inom industrin tolkade vinsterna. VINSTER OCH LÖNSAMHET, Facken inom Industrin 8 december 2011). ”. ”. Vinsterna (enligt Facken inom Industrin december 2011). Källa: Unionens bolagsindikator. Rörelsemarginaler för industri i Sverige 2005 – 2010. 16%. 14%. 12%. 10%.

E N D
Facken inom industrin tolkade vinsterna VINSTER OCH LÖNSAMHET, Facken inom Industrin 8 december 2011) ” ”
Vinsterna (enligt Facken inom Industrin december 2011) Källa: Unionens bolagsindikator
Rörelsemarginaler för industri i Sverige 2005 – 2010 16% 14% 12% 10% Tillverkningsindustri totalt enlig SCB 8% Teknikindustri enligt SCB 6% Teknikföretagenligt Teknikföretagen 4% 2% 0% 2005 2006 2007 2008 2009 2010 Vinsterna (enligt SCBs företagsstatistik och Teknikföretagen) Källa: SCB (6 december 2011 för år 2010, Teknikföretagen)
Vinsterna(enligt SCBs företagsstatistik och Teknikföretagen) • Rörelsemarginaler för industri i Sverige 2006 - 2011 Tillverkningsindustri totalt enlig SCB Teknikindustri enligt SCB Teknikföretagenligt Teknikföretagen Källa: SCB (17 september 2012 för år 2011, Teknikföretagen