Download
1 / 37
370 likes | 556 Views
The External Environment for Developing Countries October 2009 The World Bank Development Economics Prospects Group. The DOW regains 10,000. Source: Thomson/ Datastream . Dollar declines imply a return to pre-crisis levels of the effective exchange rate Indices, 2000=100.

E N D
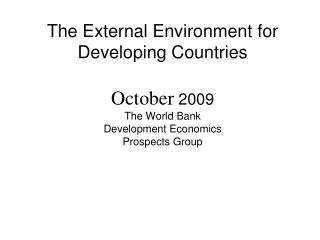
The External Environment for Developing CountriesOctober 2009The World BankDevelopment EconomicsProspects Group
The DOW regains 10,000 Source: Thomson/Datastream.
Dollar declines imply a return to pre-crisis levels of the effective exchange rate Indices, 2000=100. Nominal effective rate [NEER] Neer 85.5 Neer 87.1 Real effective rate [REER] Source: JPMorgan-Chase.
U.S. retail sales shows some underlying strength as auto incentives pass retail sales (total and ex autos) growth (saar) [L]; change in employment (‘000, 3mma) [R] Retail x autos [L] Retail sales total [L] Change in employ [R] Source: U.S. Departments of Commerce and Labor.
A revival in both domestic and foreign demand is coming to support output growth export volumes, capital goods orders ch% (saar) [L]; IP mfgrch% (saar) [R] Export volumes [L] Capital goods orders [L] IP manufacuring [R] Source: Department of Commerce and Federal Reserve System.
U.S. spending up 17.8%, receipts down 16.6% yields fiscal deficit of about 10% of GDPacutal FY 2008 and preliminary FY 2009 federal budget accounts ($trillion) Deficit: $459 billion, 3.2% GDP Deficit: $1,409 billion, 9.9% GDP Source: Treasury, OMB and CBO.
A change in sentiment toward stronger growth in Japan?household spending and wages, ch% (y/y) [L]; Tokyo consumer sentiment [R] Household expenditure [L] Wages, growth y/y [L] Consumer confidence [R] Source: Japan Cabinet Office.
Japan’s orders-, exports and production take another leg up during Augustcore machinery orders, export volumes and mfgr output, ch% saar Production Goods export volumes Core machinery orders Source: Bank of Japan and Japan Cabinet Office.
Deflation continues in Japan Headline, core CPI and Corp gds prices, ch% (y/y) Source: Japan Cabinet Office.
Euro Area production moves sharply higher in August– due in part to auto incentivesmanufacturing output, ch% (saar) France Euro Area Italy Germany Source: Eurostat.
Household spending remains weakas unemployment continues to mount Euro Area unemployment rate (%) [L] and retail volume growth (y/y) [R] Germany sales [R] Italy [R] France [R] EA unemployment rate [L] Source: EUROSTAT.
Euro appreciation may come to affect export prospects euro cross exchange rates for select trade partners (LCU per euro) Source: Thomson/Datastream and DECPG.
East Asia’s production rebound is moderating percent change, 3m/3m saar East Asia and Pacific World Source: World Bank, DEC Prospects Group
High income country developments driving the global IP cycle contributions to global IP growth (% q-o-q) Source: World Bank, DEC Prospects Group.
IP remains below pre-crisis peaks except in East- and South Asia pre-crisis peak = 100 Source: World Bank, DEC Prospects Group
U.S. trade deficit shrinks as personal savings rate rises from record lows Trade balance $ bn [R]; Personal savings as a percent of disposable income [L] Trade balance [R] Personal Savings rate [L] Source: U.S. Department of Commerce.
Investment-driven imports by China poised to slow gross fixed capital formation [R]; Imports excl oil [L] %chg saar Source: Haver Analytics.
Emerging Asia leads import recovery Total import volumes, 3mma seasonally adjusted annualized % change East Asia including China East Asia excl. China Source: World Bank, DEC Prospects Group.
Oil prices and OECD oil stocks $/bbl million bbl OECD stocks [R] Oil price [L scale] Source: IEA and DECPG Commodities Group.
World Oil Consumption Growth mb/d Source: IEA.
OPEC Spare Capacity (mb/d) Source: IEA and DECPG Commodities Group.
Fats & Oils, and grains off in October (2000=100) Source: DECPG Commodities Group.
Copper stocks and prices $/ton ‘000 tons Copper price LME stocks Source: LME and DECPG Commodities Group.
Freight rates fall on weaker demand and increases in new vessel capacity Baltic dry freight index Source: Datastream and DECPG Commodities Group.
A substantial pickup in flows in September Source: DECPG Finance Team.
Corporates regain lead in EM bond activitybillions US dollars Source: World Bank, DEC Prospects Group
EM IPO activity regains momentum Number of deals [Line, right] Capital raised [Bars, left] Source: DECPG, Finance Team.
Dollar’s fall picks up in September and October USD per Euro (inverse) [Left] and Yen per USD [right] USD/Euro (inverse) yen/USD Source: Thomson/Datastream.
Dollar declines imply a return to pre-crisis levels of the effective exchange rate Indices, 2000=100. Nominal effective rate [NEER] Neer 85.5 Neer 87.1 Real effective rate [REER] Source: JPMorgan-Chase.
The External Environment for Developing CountriesOctober 2009The World BankDevelopment EconomicsProspects Group