Classifying Lymphoma Dataset Using SVM: Advanced Data Mining Techniques
310 likes | 372 Views
This project focuses on utilizing Multi-class Support Vector Machines to classify lymphoma types based on gene expression profiling data. The dataset includes 96 samples of lymphocytes and 4026 human genes, categorized into 9 classes of lymphoma. By preprocessing the data to handle missing values and selecting informative features, the SVM classification aims to improve cancer categorization for more accurate diagnoses and targeted therapies. References include the Alizadeh et al. study on gene expression profiling of Diffuse Large B-cell Lymphoma. Techniques such as Missing Values Imputation and Feature Selection are employed to enhance classification accuracy.

Classifying Lymphoma Dataset Using SVM: Advanced Data Mining Techniques
E N D
Presentation Transcript
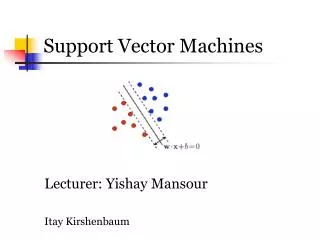
Classifying Lymphoma Dataset Using Multi-class Support Vector Machines INFS-795 Advanced Data Mining Prof. Domeniconi Presented by Hong Chai
Agenda (1) Lymphoma Dataset Description (2) Data Preprocessing - Formatting -Dealing with Missing Values - Gene Selections (3) Multi-class SVM Classification -1-against-all - 1-against-1 (4) Tools (5) References
Lymphoma Dataset • Alizadeh et al.(2000), Distinct Types of Diffuse Large B-cell Lymphoma Identified by Gene Expression Profiling • Publicly available at http://llmpp.nih.gov/lymphoma/ • In microarray data, Expression profiling of genes are measured in rows Samples are columns
Lymphoma Dataset • 96 samples of lymphocytes (instances) • 4026 human genes (features) • 9 classes of lymphoma: DLBCL, GCB, NIL, ABB, RAT, TCL, FL, RBB, CLL • Glimpse of data
Goal Task: classification • Assign each patient sample to one of 9 categories, e.g. Diffuse Large B-cell Lymphoma (DLBCL) or Chronic Lymphocytic Leukemia (CLL). • Microarray data classification: an alternative to current malignancies classification that relies on morphological or clinical variables Medical implications • Precise categorization of cancers; more relevant diagnosis • More accurate assignment of cases to high risk or low risk categories • more targetedtherapies • Improved predictability of outcome.
Data Preprocessing Missing ValuesImputation • 3% of gene expression profiles data are missing • 1980 of the 4026 genes have missing values • 49.1% of genes (features) involved • Some of these genes may be highly informative for classification • Need to deal with missing values before applying to SVM
Missing Value Approaches • Instance or feature deletion - if dataset large enough & does not distort distribution • Replace with a randomly drawn observed value - proved to work well (http://globain/cse/psu.edu/courses/spring2003/3-norm-val.pdf) • EM algorithm • Global mode or mean substitution - will distort distribution • Local mode or mean substitution with KNN algorithm (Prof. Domeniconi)
Local Mean Imputation (KNN) • Partition the data set D into two sets. • Let the first set, Dm, contain instances with missing value(s). • The other set, Dc, contains instances with complete values. 2. For each instance vector x Dm • Divide the vector into observed and missing parts as x = [xo; xm]. • Calculate the distance between xo and every instance y Dc, using only those features that are observed in x. • From the K closest y’s (instances in Dc), calculate the mean of the feature for which x has missing value(s). Make substitution with this local mean. (Note: for nominal features use mode. n/a in microarray data)
Data Preprocessing Feature Selection: Motivations - Number of features large, instances small - Reduce dimensionality to overcome overfitting - A small number of discriminant “marker” genes may characterize different cancer classes Example:Guyon et al. identified 2 genes that yield zero leave- one-out error in the leukemia dataset, 4 genes in the colon cancer dataset that give 98% accuracy. (Guyon et al. Gene Selection for Cancer Classification using SVM, 2002)
Feature Selection Discriminant Score Ranking • Which gene is more informative in the 2-class case: + - + - Gene 1 Gene 2
Separation Score • Gene 1 more discriminant. Criteria: - Large difference of μ+ and μ- - Small variance within each class • Score function F(gj) = | (μj+ - μj-) / (σj+ + σj-) |
Separation Score • In multi-class cases, rank genes that are discriminant among multiple classes C1C2ΔC3 • A gene may functionally relates to several cancer classes such as C1 and C2
Separation Score • Proposing an adapted score function For each gene j Calculate μi in each classCi Sort μi in descending order Find a cutoff point with largest diff(μi, μj) μ+μexp-cutoff-left σ+σexp-cutoff-left μ-μexp-cutoff-right σ-σexp-cutoff-right F(gj) = |(μj+ - μj-) / (σj+ + σj-) | Rank genes by F(gj) Select top genes via threshold
Separation Score Disadvantage: • Does not yield more compact gene sets; still abundant • Does not consider mutual information between genes
Feature Selection Recursive Feature Elimination/SVM • In the linear SVM model on the full feature set Sign (w•x + b) w is a vector of weights for each feature, x is an input instance, and b a threshold. If wi = 0, feature Xi does not influence classification and can be eliminated from the set of features.
RFE/SVM 2. When w is computed for the full feature set, sort features according in descending order of weights. The lower half is eliminated. 3. A new linear SVM is built using the new set of features. Repeat the process until the set of predictors is non-divisible by two. 4. The best feature subset is chosen.
Feature Selection • PCA comment: not common in microarray data. • Disadvantage: none of original inputs can be discarded • We want to retain a minimum subset of informative genes to achieve best classification performance.
Multi-class SVM Approaches 1-against-all • Each of the SVMs separates a single class from all remaining classes (Cortes and Vapnik, 1995) 1-against-1 • Pair-wise. k(k-1)/2, k Y SVMs are trained. Each SVM separates a pair of classes (Fridman, 1996) Performance similarin some experiments(Nakajima, 2000) Time complexity similar:k evaluation in 1-all, k-1 in 1-1
1 -against- All • Or “one-against-rest”, a tree algorithm • Decomposed to a collection of binary classifications • k decision functions, one for each class (wk)T• x+bk,k Y • The kth classifier constructs a hyperplane between class n and the k-1 other classes Class of x = argmaxi{(wi)T •(x)+bi}
1 -against- 1 • k(k-1)/2 classifiers where each one is trained on data from two classes • For training data fromithandjthclasses, run binary classification • Voting strategy: If Sign(wij)T• x+bij) says x is in class i, then add 1 to class i. Else to class j. • Assign x to class with largest vote (Max wins)
Kernels to Experiment • Polynomial kernels K(Xi, Xj)=(XiXj+1)^d • Gaussian Kernels K(Xi, Xj)=e^(-|| Xi -Xj ||/σ^2)
SVM Tools - Weka Data Preprocessing • To ARFF format • Import file
SVM Tools - Weka Feature Selection using SVM • Select Attribute • SVMAttributeEval
SVM Tools - Weka Multi-class classifier • Classify • Meta • MultiClassClassifier (Handles multi-class datasets with 2-class classifiers)
SVM Tools - Weka • Multi-class SVM • Classify • Functions • SMO (Weka’s SVM)
SVM Tools - Weka • Multi-class SVM Options • Method 1-against-1 1-against-all • Kernel options not found
Multi-class SVM Tools Other Tools include • SVMTorch (1-against-all) • LibSVM (1-against-1) • LightSVM
References • Alizadeh et al. Distinct types of diffuse large B-cell lymphoma identified by gene expression profiling, 1999 • Cristianini, An Introduction to Support Vector Machines, 2000 • Dor et al, Scoring Genes for Relevance, 2000 • Franc and Hlavac, Multi-class Support Vector Machines • Furey et al. Support vector machine classification and validation of cancer tissue samples using microarray expression data, 2000 • Guyon et al. Gene Selection for Cancer Classification using Support Vector Machines, 2002 • Selikoff, The SVM-Tree Algorithm, A New Method for Handling Multi-class SVM, 2003 • Shipp et al. Diffuse Large B-cell lymphoma outcome prediction by gene expression profiling and supervised machine learning, 2002 • Weston, Multi-class Support Vector Machines, Technical Report, 1998